- Date:
- 14 Mar 2023
The Fire Rescue Victoria Fire District Review 2020-24 commenced on 1 July 2020 and is now complete, with the Fire District Review Panel’s findings provided to the Minister for Emergency Services in June 2024.
The Fire District Review Panel (the Panel) is bound by legislative requirements contained in section 4 of the Fire Rescue Victoria Act 1958 (the Act) to undertake a review of the Fire Rescue Victoria fire district boundaries on a four-yearly cycle.
The Panel published its determination in the Victorian Government Gazette on 30 March 2023.
The Fire Rescue Victoria Fire District Review 2020–24: Supporting Report to the Determination accompanies the determination and contains information about the fire risk assessment methodology that has been applied for the assessment of changes in fire risk. It also provides further information on areas that are identified as requiring Country Fire Authority advice to the Panel.
List of abbreviations
| Abbreviation | Definition |
|---|---|
| ABS | Australian Bureau of Statistics |
| BCTB | Building fire casualty to total building fire |
| BMO | Bushfire Management Overlay |
| CBD | Central business district |
| CFA | Country Fire Authority |
| DSA | Decision support analysis |
| FRV | Fire Rescue Victoria |
| GIS | Geographic information system |
| IRSD | Index of Relative Socio-economic Disadvantage |
| KDE | Kernel density estimation |
| MCE | Markov chain estimation |
| MVA | Motor vehicle accident |
| PSP | Precinct Structure Plan |
| SA1 | Statistical Area Level 1 |
| SA2 | Statistical Area Level 2 |
| SDS | Service Delivery Standard |
| SRA | Station response area |
| VCTV | Vehicle fire/MVA casualty to total vehicle fire/MVA |
| VPA | Victorian Planning Authority |
Chair’s foreword
The independent Fire District Review Panel (the Panel) was established under section 4 of the Fire Rescue Victoria Act 1958 (the Act) to provide recommendations, every four years, to the Minister for Emergency Services (the Minister) about the change in risk around Fire Rescue Victoria (FRV) fire district boundaries. In undertaking this work, areas serviced by the Country Fire Authority (CFA) adjacent to the FRV fire district boundaries were necessarily considered.
The inaugural Panel was appointed in 2020, and the determination of a change in fire risk is part of its first four-yearly review.
From commencement, the Panel was clear about applying an evidence-based approach to the statewide assessment of fire risk, and about engaging with key stakeholders to ensure that a robust, transparent and analytical methodology was developed.
This Supporting Report to the Determination (Supporting Report) contains information about the Panel’s risk-based methodology. Background material is available on the Panel’s website vic.gov.au/fire-district-review-panel.
The application of this foundational methodology provides a statewide baseline for future Panel reviews of changes in fire risk. In future years the methodology can be adapted and enhanced as more research and data become available for factors affecting fire risk.
The determination identifies 13 CFA areas adjacent to FRV fire district boundaries that require further advice to the Panel from the CFA as to how they will support the capacity of relevant volunteer brigades to respond effectively to the change in fire risk.
This advice from the CFA to the Panel is due no later than 30 January 2024.
The Panel will provide other key stakeholders with an opportunity to comment on the determination, including FRV, affected local government municipalities, and organisations that represent both volunteer and employed firefighters.
Beyond the determination, where changes in fire risk have also been identified in either areas not adjacent to, or within, the FRV fire district boundaries, the Panel will undertake further analysis and provide information to the fire agencies to assist with capacity building decision-making. The Department of Justice and Community Safety will also be advised.
It should be noted that the Act makes provision for the Minister to request the Panel undertake a specific review upon receiving recommendation from the Secretary, Department of Justice and Community Safety, where there is evidence of a change in fire risk and that change warrants such a review.
On behalf of the Panel, I would like to acknowledge the cooperation of the CFA and FRV in provision of knowledge and data that informed the analysis, the support provided by the Department of Justice and Community Safety in the establishment phase of the Office of the Fire District Review Panel, and contributions by other key stakeholders, especially during the refinement of the Panel’s methodology.
Special thanks to the staff in the Office of the Fire District Review Panel whose specialist expertise has enabled the Panel to discharge its legislative responsibilities.
Valerie Callister PSM
Chair
Executive summary
The Fire District Review Panel (the Panel) was established as an independent public entity on 1 July 2020 by the Fire Rescue Victoria Act 1958 (the Act) to undertake a review of the Fire Rescue Victoria (FRV) fire district boundaries on a four-yearly cycle. The Panel is bound by legislative requirements contained in section 4 of the Act.
The Act requires the Panel to use a risk-based assessment of changes in fire risk to inform recommendations to the Minister for Emergency Services (the Minister) about the FRV district boundaries. It also requires the Panel to consult with fire agencies in the development of its recommendations.
This Supporting Report to the Determination (Supporting Report) outlines the fire risk assessment methodology that has been developed and used to assess changes in fire risk. An overview of the methodology is provided in Figure 1 of this report and more detail is available on the Panel’s website vic.gov.au/fire-district-review-panel.
It accompanies the Panel’s determination published in the Victorian Government Gazette on 30 March 2023.
The inaugural review period commenced on 1 July 2020 and is due for completion by 30 June 2024.
Determination
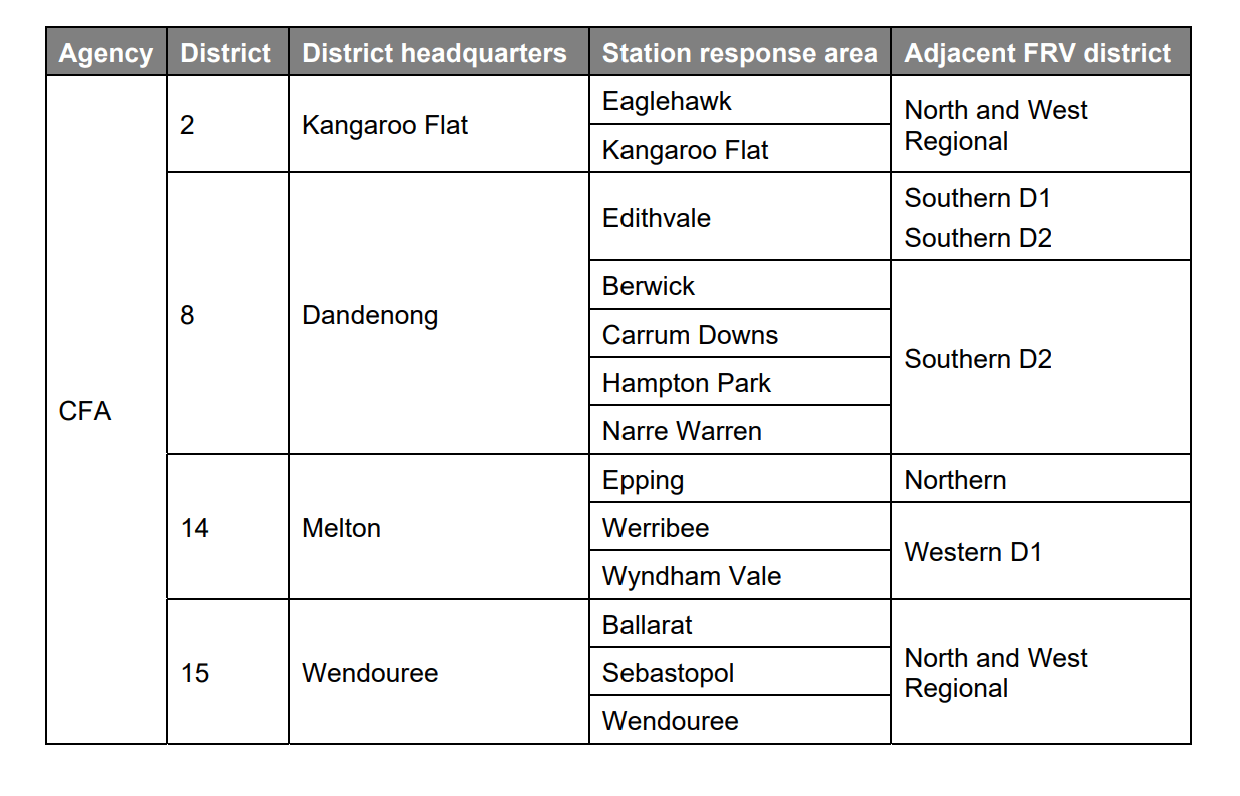
Through a statewide analysis, 13 station response areas adjacent to FRV fire district boundaries were identified as requiring CFA advice to the Panel. These 13 station response areas are listed in Table E1 and form the Fire District Review Panel’s determination.
Table E1
Next steps
As specified in section 4K(1)(b)(ii) of the Act, from the date of gazettal, the review must be suspended to allow the CFA to provide a response to the Panel’s determination.
Following receipt of advice from the CFA and in consideration of other submissions, the Panel will undertake further analysis. The Panel will then prepare final recommendations for the Minister by 30 June 2024.
The Panel's next four-yearly review cycle of the FRV fire district boundaries will commence 1 July 2024.
Information about the Fire District Review Panel and their previous and ongoing work is available via vic.gov.au/fire-district-review-panel
1. Introduction
Introduction
1.1 Legislative context
As part of the Victorian Government’s reform of the state’s fire services based on recommendations from the 2009 Victorian Bushfires Royal Commission, the Fire District Review Panel (the Panel) was established as an independent public entity under section 4 of the Fire Rescue Victoria Act 1958 (the Act) to undertake reviews of the Fire Rescue Victoria (FRV) fire district boundaries at least once every four years.
The Panel’s role is to provide independent advice to the Minister for Emergency Services (the Minister) on whether changes to fire risk across the state (including both the FRV fire district and the country area of Victoria as serviced by the Country Fire Authority [CFA]) resulting from population growth, service demand, land use and any other change in circumstances that may require a change to a FRV fire district.
The inaugural review commenced on 1 July 2020 and will be completed with recommendations made to the Minister by 30 June 2024.
As part of the review, the Panel is required, under section 4K(1)(a)(i) of the Act, to publish its determination in the Victorian Government Gazette (the Gazette) where it has determined there is a change in fire risk.
The Panel’s determination was published on 30 March 2023.
1.2 Purpose of this Supporting Report to the Determination
This report accompanies the Panel’s gazettal of its determination and outlines the supporting analysis and methodology.
This report includes the following:
- Methodology for the assessment of fire risk
- Fire risk mapping
- Focused areas where risk is to be addressed by the CFA
1.3 Process of the review
A unique and targeted methodology was developed to utilise a range of historical and predictive data. This methodology was refined after consultation with key stakeholders and community.
Critical data was then collated for the analysis, which included incident data from FRV and CFA for the period 2010 to 2019 and, aligned Australian Bureau of Statistics (ABS) data from the 2016 Census, down to the Statistical Area Level 11 (SA1) scale.
A consideration of limitations and assumptions, particularly in relation to the methodology and data, is provided at Appendix A.
The Panel’s determination is a result of the analysis of a range of data and information. From here, the determination is to be responded to by the CFA. The Panel will also consider submissions from other key stakeholders prior to the Panel finalising its recommendations to the Minister by 30 June 2024.
Footnotes
2. Application of the risk assessment methodology
2.1 What is risk?
Risk is the likelihood of a hazard occurring, whereas a hazard is something that has the potential to cause harm, based on exposure and vulnerability to that hazard.
In assessing fire risk, the fire represents the hazard, and the likelihood of fire is examined as a function of past fire history (incident data from FRV and the CFA). Response time affects the level of exposure to the hazard. Casualties result from both exposure and vulnerability to the fire and may be viewed as an impact or consequence of the fire.
In addition to fire incidents, the Panel has also considered motor vehicle accidents (MVAs) in the assessment of risk due to the potential for the ignition of fuel.
2.2 Assessment of fire risk
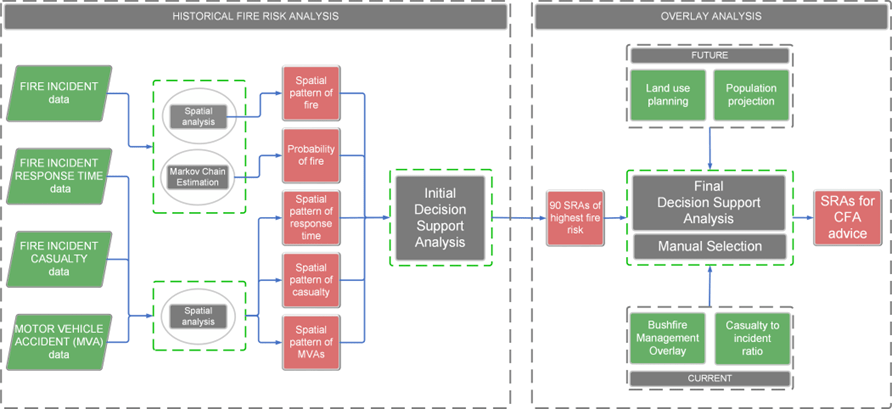
Fire risk is assessed using a combination of techniques. An overview of the fire risk assessment methodology is presented in Figure 1.
Fire-related incidents, casualties, associated response times, and MVA data are examined via various spatial and statistical techniques at the SA1 scale.
Fire risk was also modelled using a probabilistic technique to explore the likelihood of fire over the spatial extent.
The output of these techniques was reviewed for accuracy and subsequently collated in a single feature class layer and stored in geodatabase file for input into the initial decision support analysis (DSA).
This representation of fire risk at the SA1 scale is then spatially attributed to individual station response areas (SRAs). Other pertinent information is attributed to the SRAs, including bushfire, planning, and projected population information.
Specific incident-related data (casualty to incident ratios) is also calculated for each SRA. Review of this data and a final application of the DSA produced the Panel’s determination, which is a final listing of SRAs for which CFA advice is required.
Figure 1 Overview of the fire risk assessment methodology
2.3 Changes in fire risk
Considering the definition of a change in fire risk as defined in section 3(1) of the Act, this work has established the fire risk for SRAs. The examination of change in fire risk considered datasets that represent a demand on each SRA (identified using Bushfire Management Overlay [BMO] and casualty to incident ratios), as well as the location of SRAs in terms of future demand (identified using Victorian Planning Authority [VPA] planning and population projections).
The term ‘change in fire risk’ is defined in section 3(1) of the Act as meaning:
- a change in land use or development
- a demographic change or a change in demand for the services of a fire services agency, or
- any other change in circumstances
within the Fire Rescue Victoria fire district or the country area of Victoria, that may result in a material change to the risk of a fire occurring within the Fire Rescue Victoria fire district or the country area of Victoria.
2.4 Spatial analysis of fire risk
Understanding the risk of fire associated with historical fire incidents is critical for effective placement of the fire district boundaries. Historical incidents of fire, MVAs, casualty and Service Delivery Standard (SDS) failure associated with fire have been spatially assessed using a range of spatial and statistical techniques, as outlined in the following sections.
Maps in this section have been included for transparency and completeness.
It is not appropriate to view them in isolation.
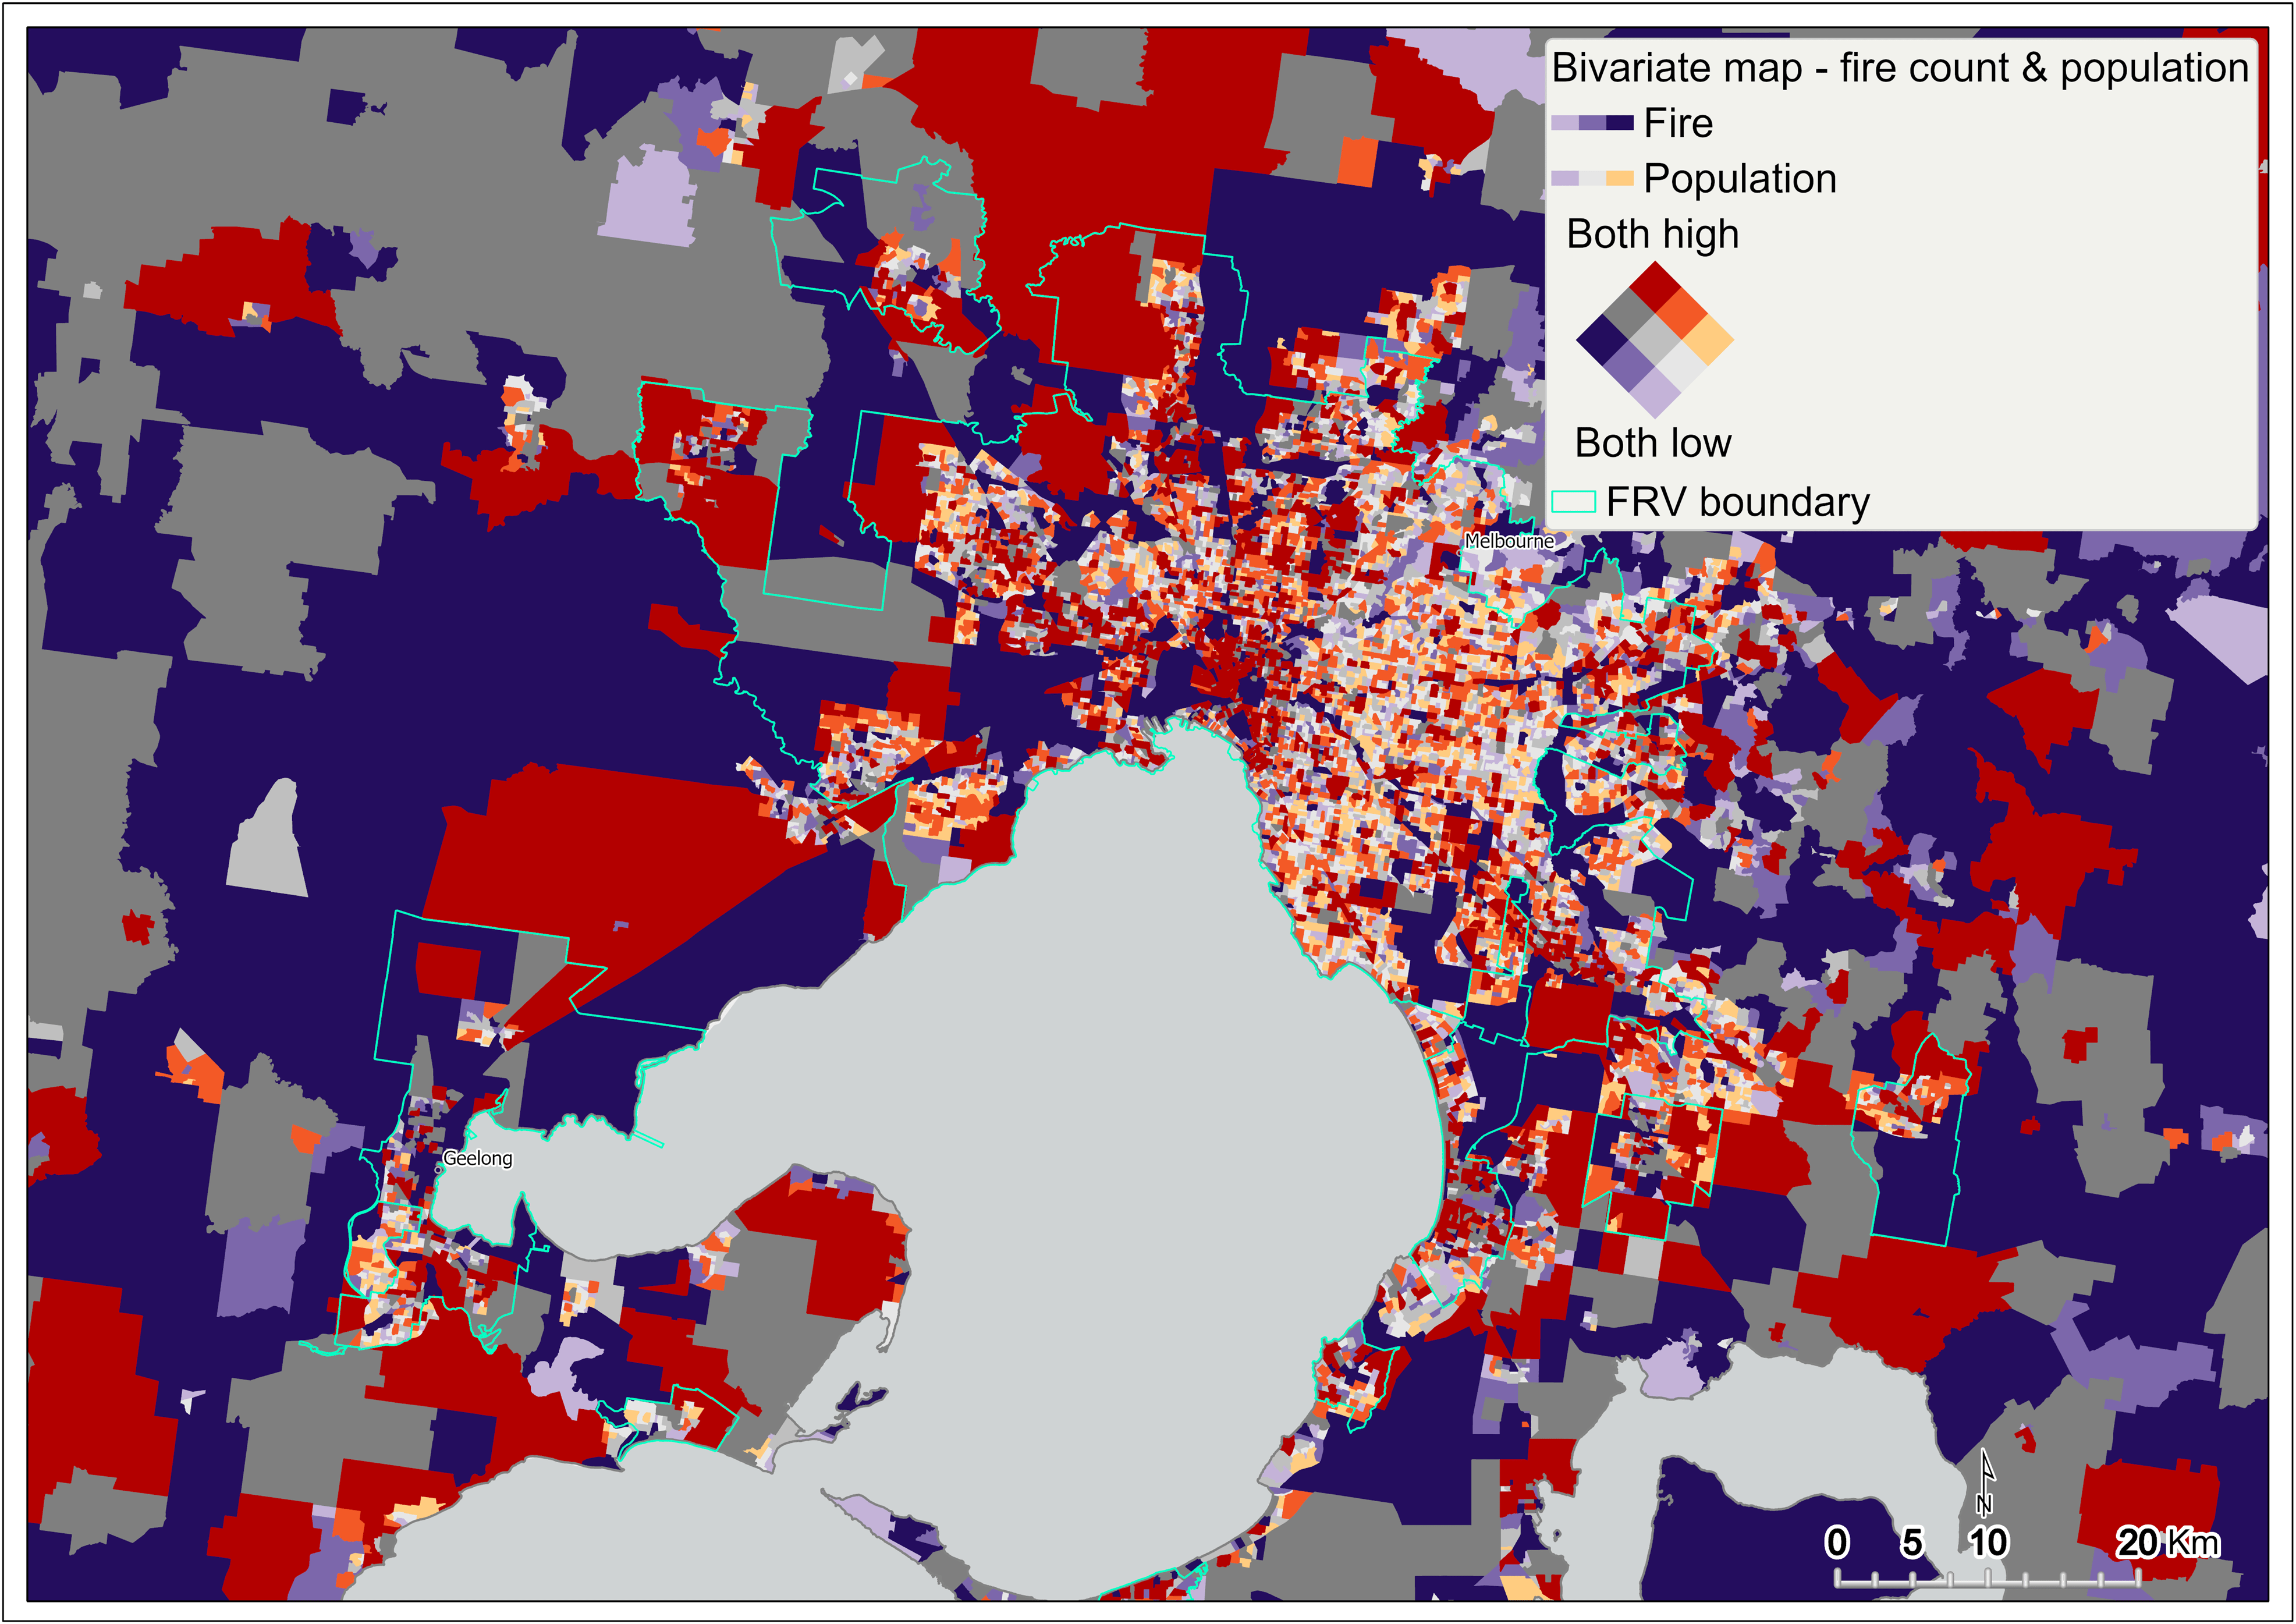
2.4.1 Bivariate mapping
Bivariate2 mapping is computed by mapping the fire count and total population across all SA1s in Victoria. It identifies areas that have both high fire count and population (Figure 2, Figure 3).
This analysis has two aims:
- to understand the spatial relationship between fire count and underlying population in Victoria
- to capture SA1 areas containing both high fire count and high population count in Victoria, to compute fire rate mapping on these SA1s, and to use this result as one of the components in the DSA. This method overcomes the disparity between the population in regional Victoria and metropolitan Melbourne when calculating the fire rate.
Figure 2 Bivariate mapping of fire count and population – statewide
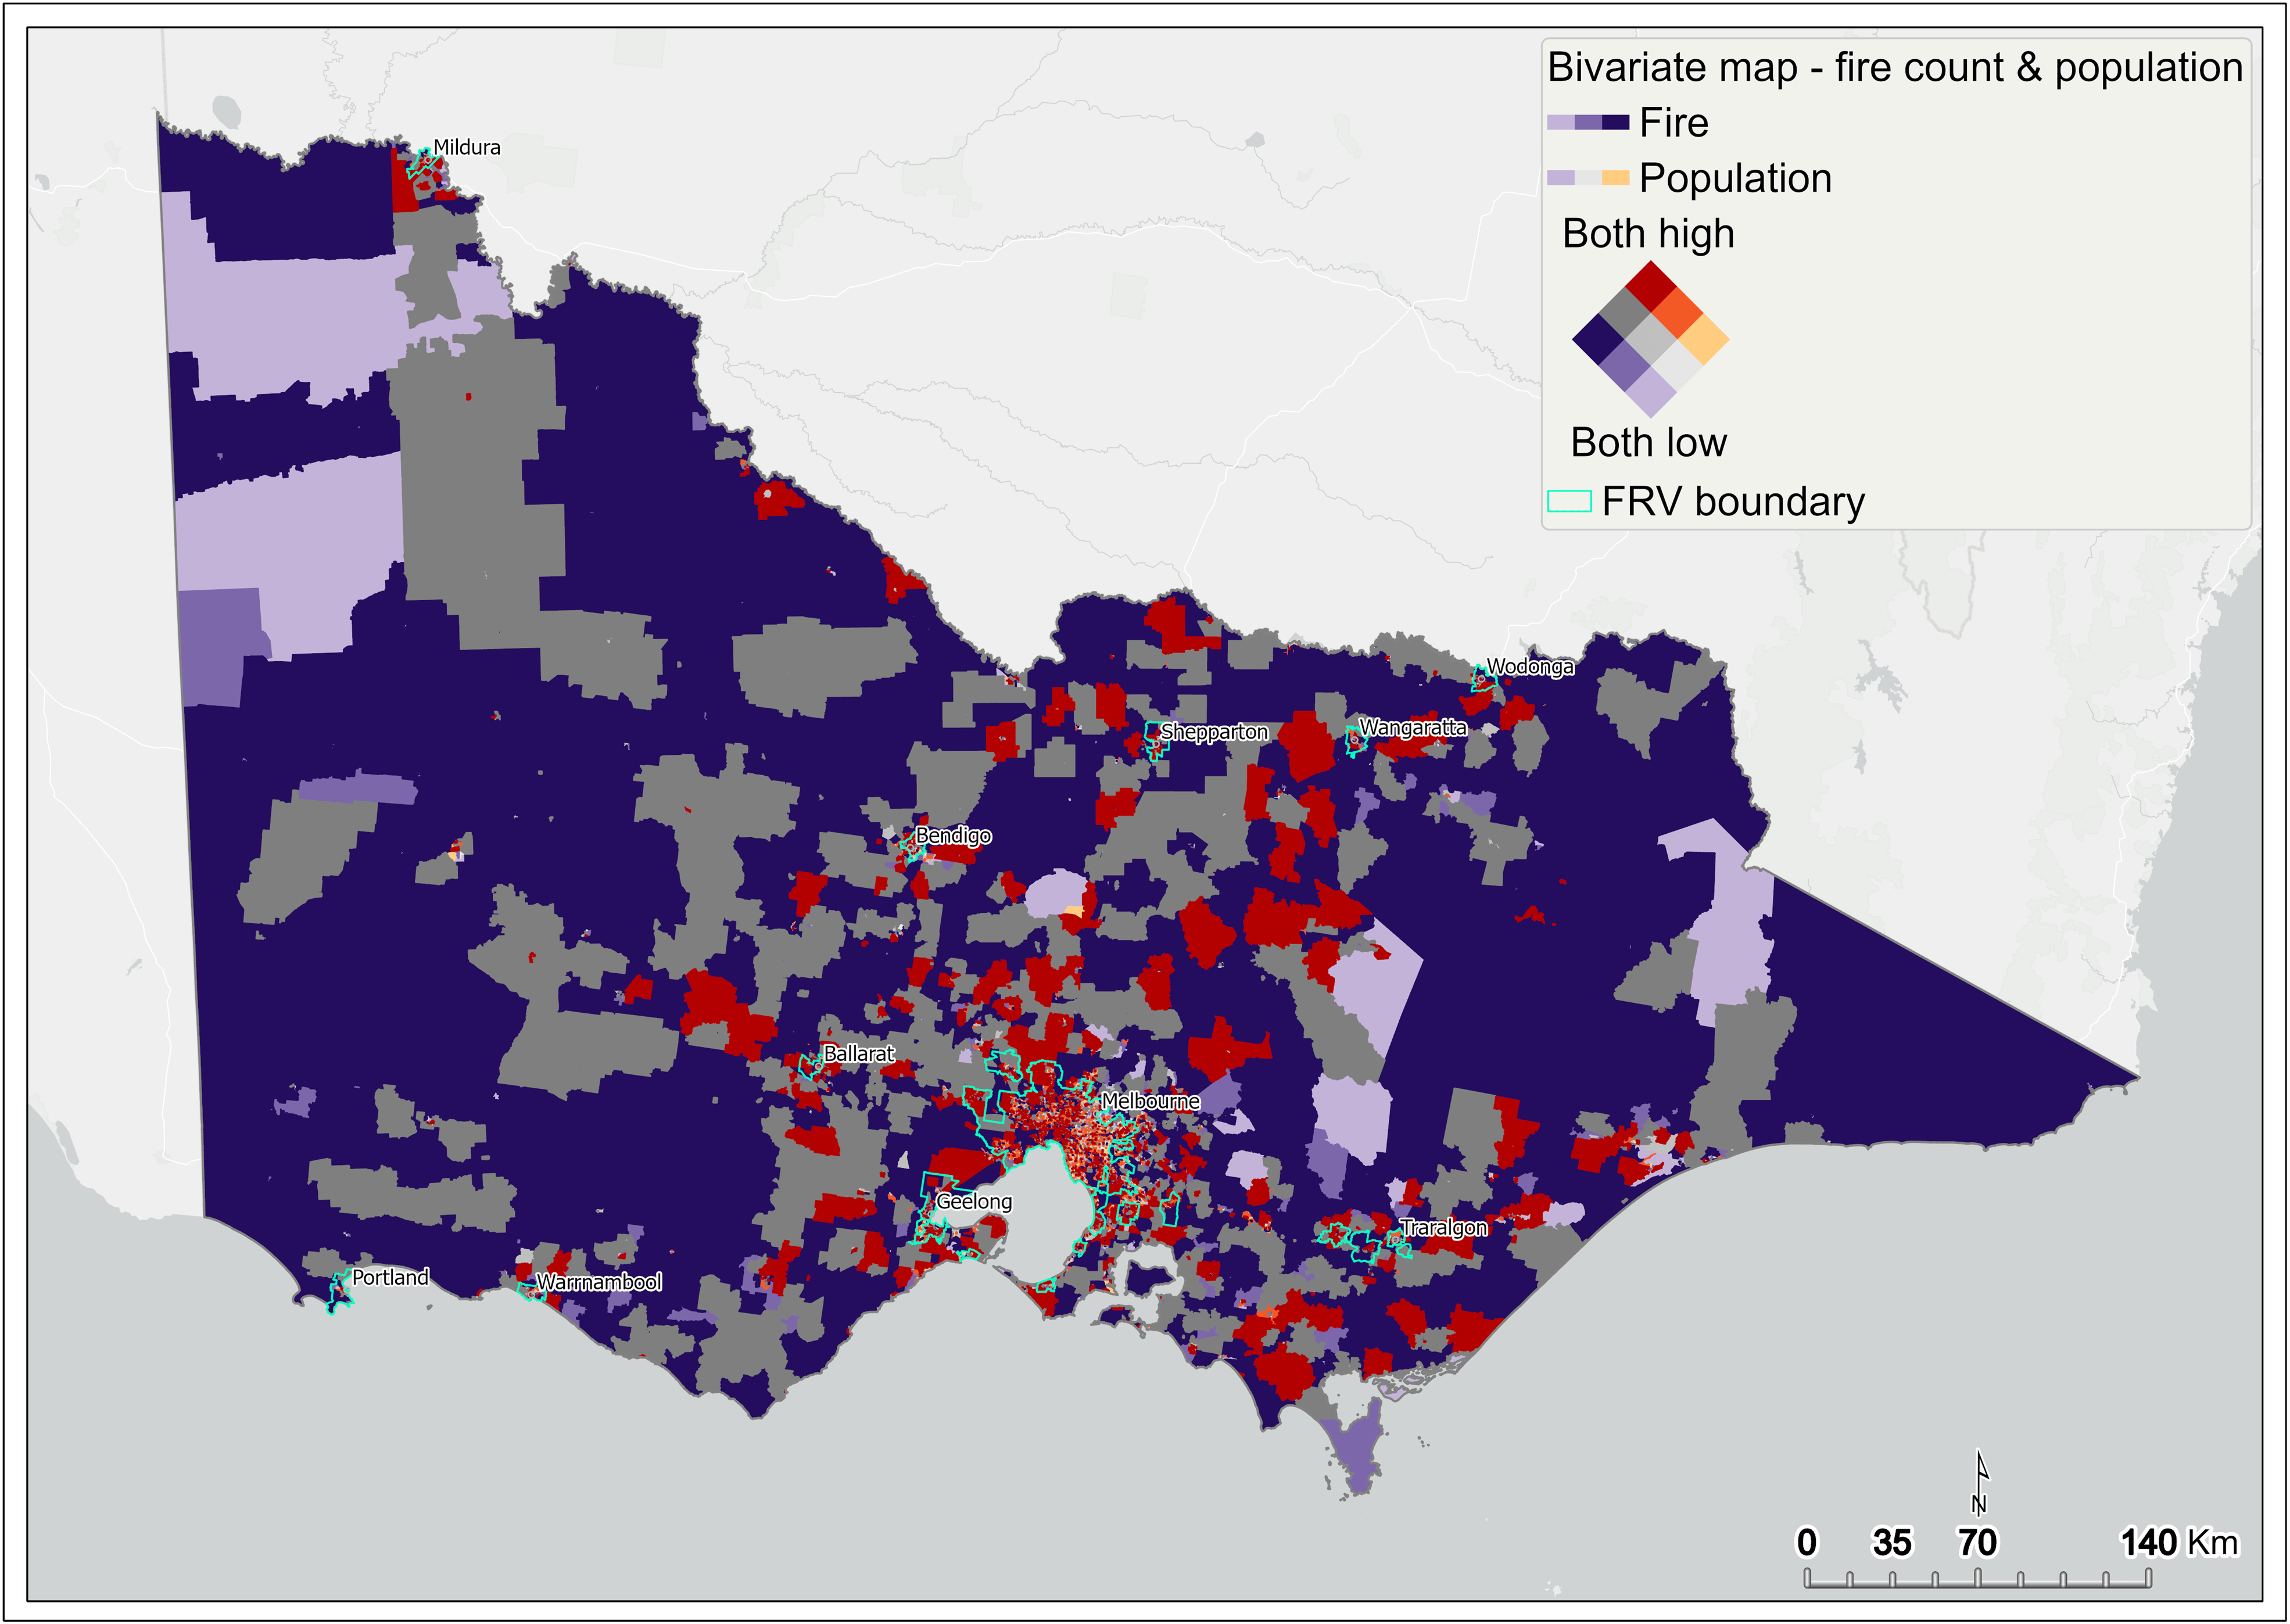
Figure 3 Bivariate mapping of fire count and population – metropolitan Melbourne
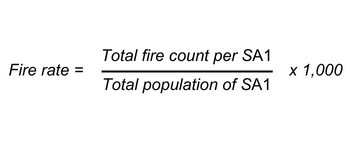
2.4.2 Fire rate
Drawing on the bivariate mapping output (only for SA1s containing high population and fire count), fire rate is computed by dividing the total fire counts by the total population of the SA1 and multiplied by 1,000.
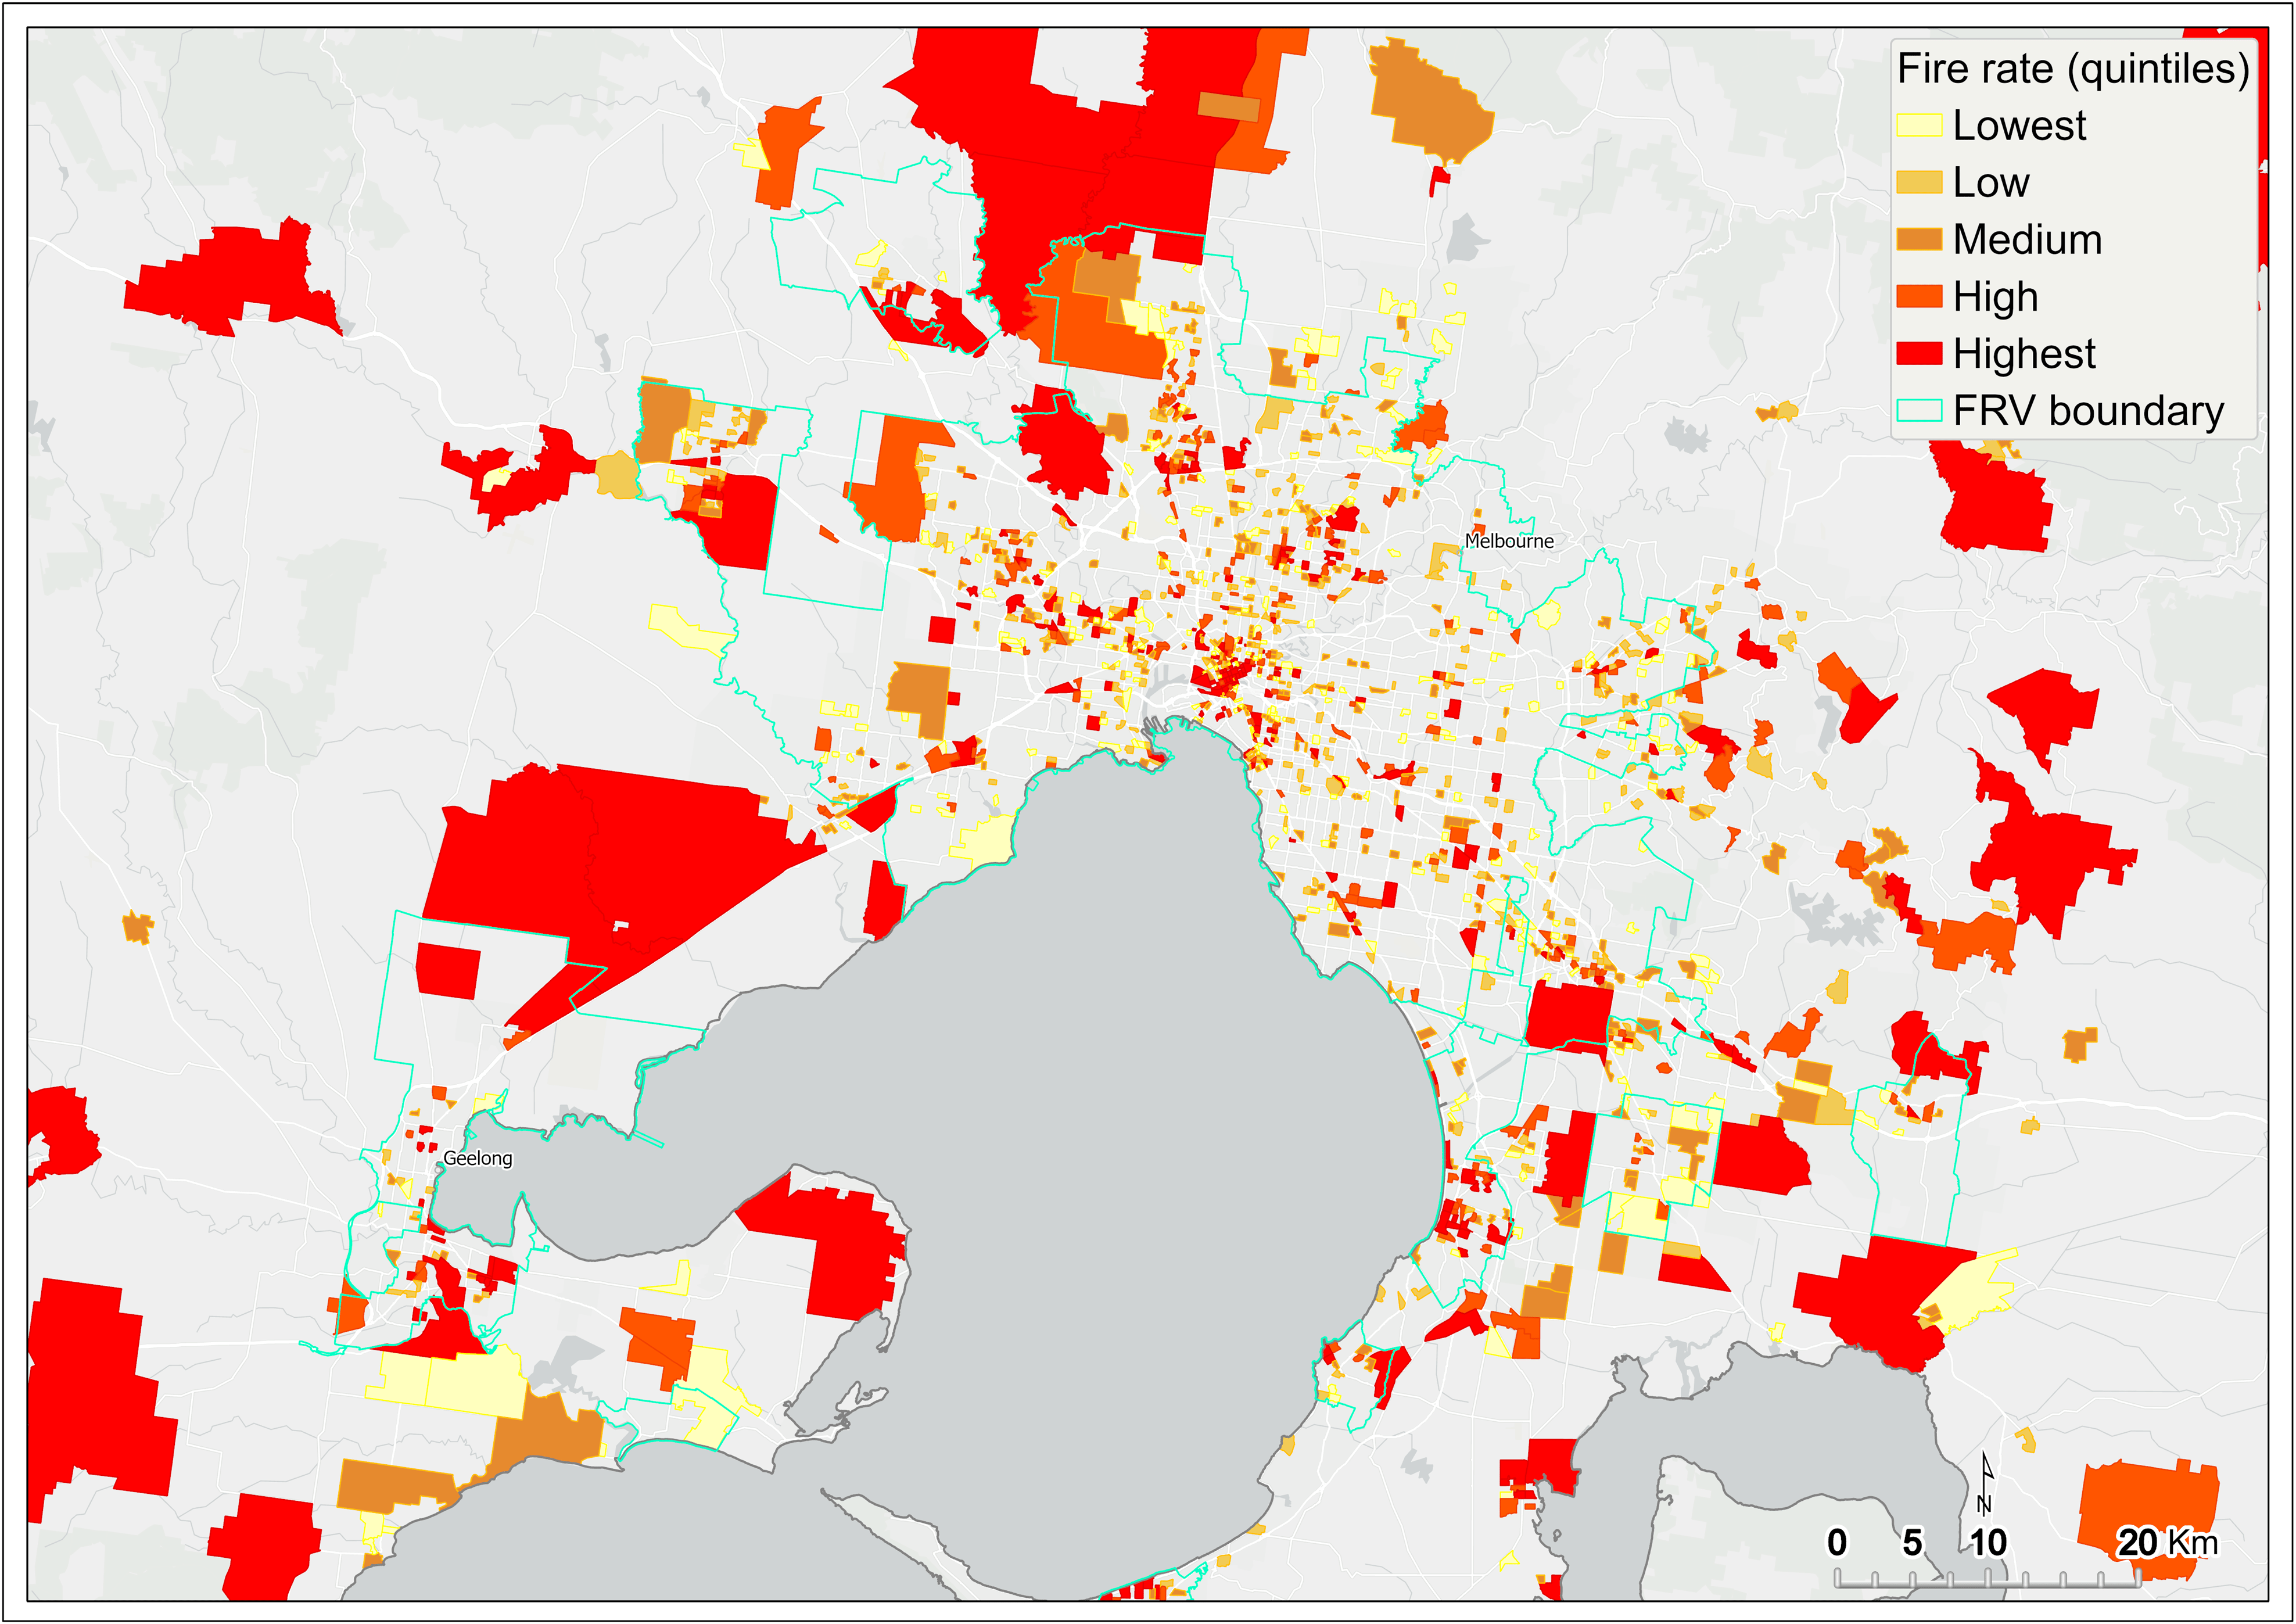
This analysis revealed the fire rate as being highest in SA1s scattered across metropolitan Melbourne, as well as in the regions extending to the New South Wales border, central Gippsland, and the Central Highlands (Figure 4, Figure 5). The subsequent fire rate output was input to the initial DSA.
Figure 4 Fire rate per 1,000 people (quintiles) – statewide
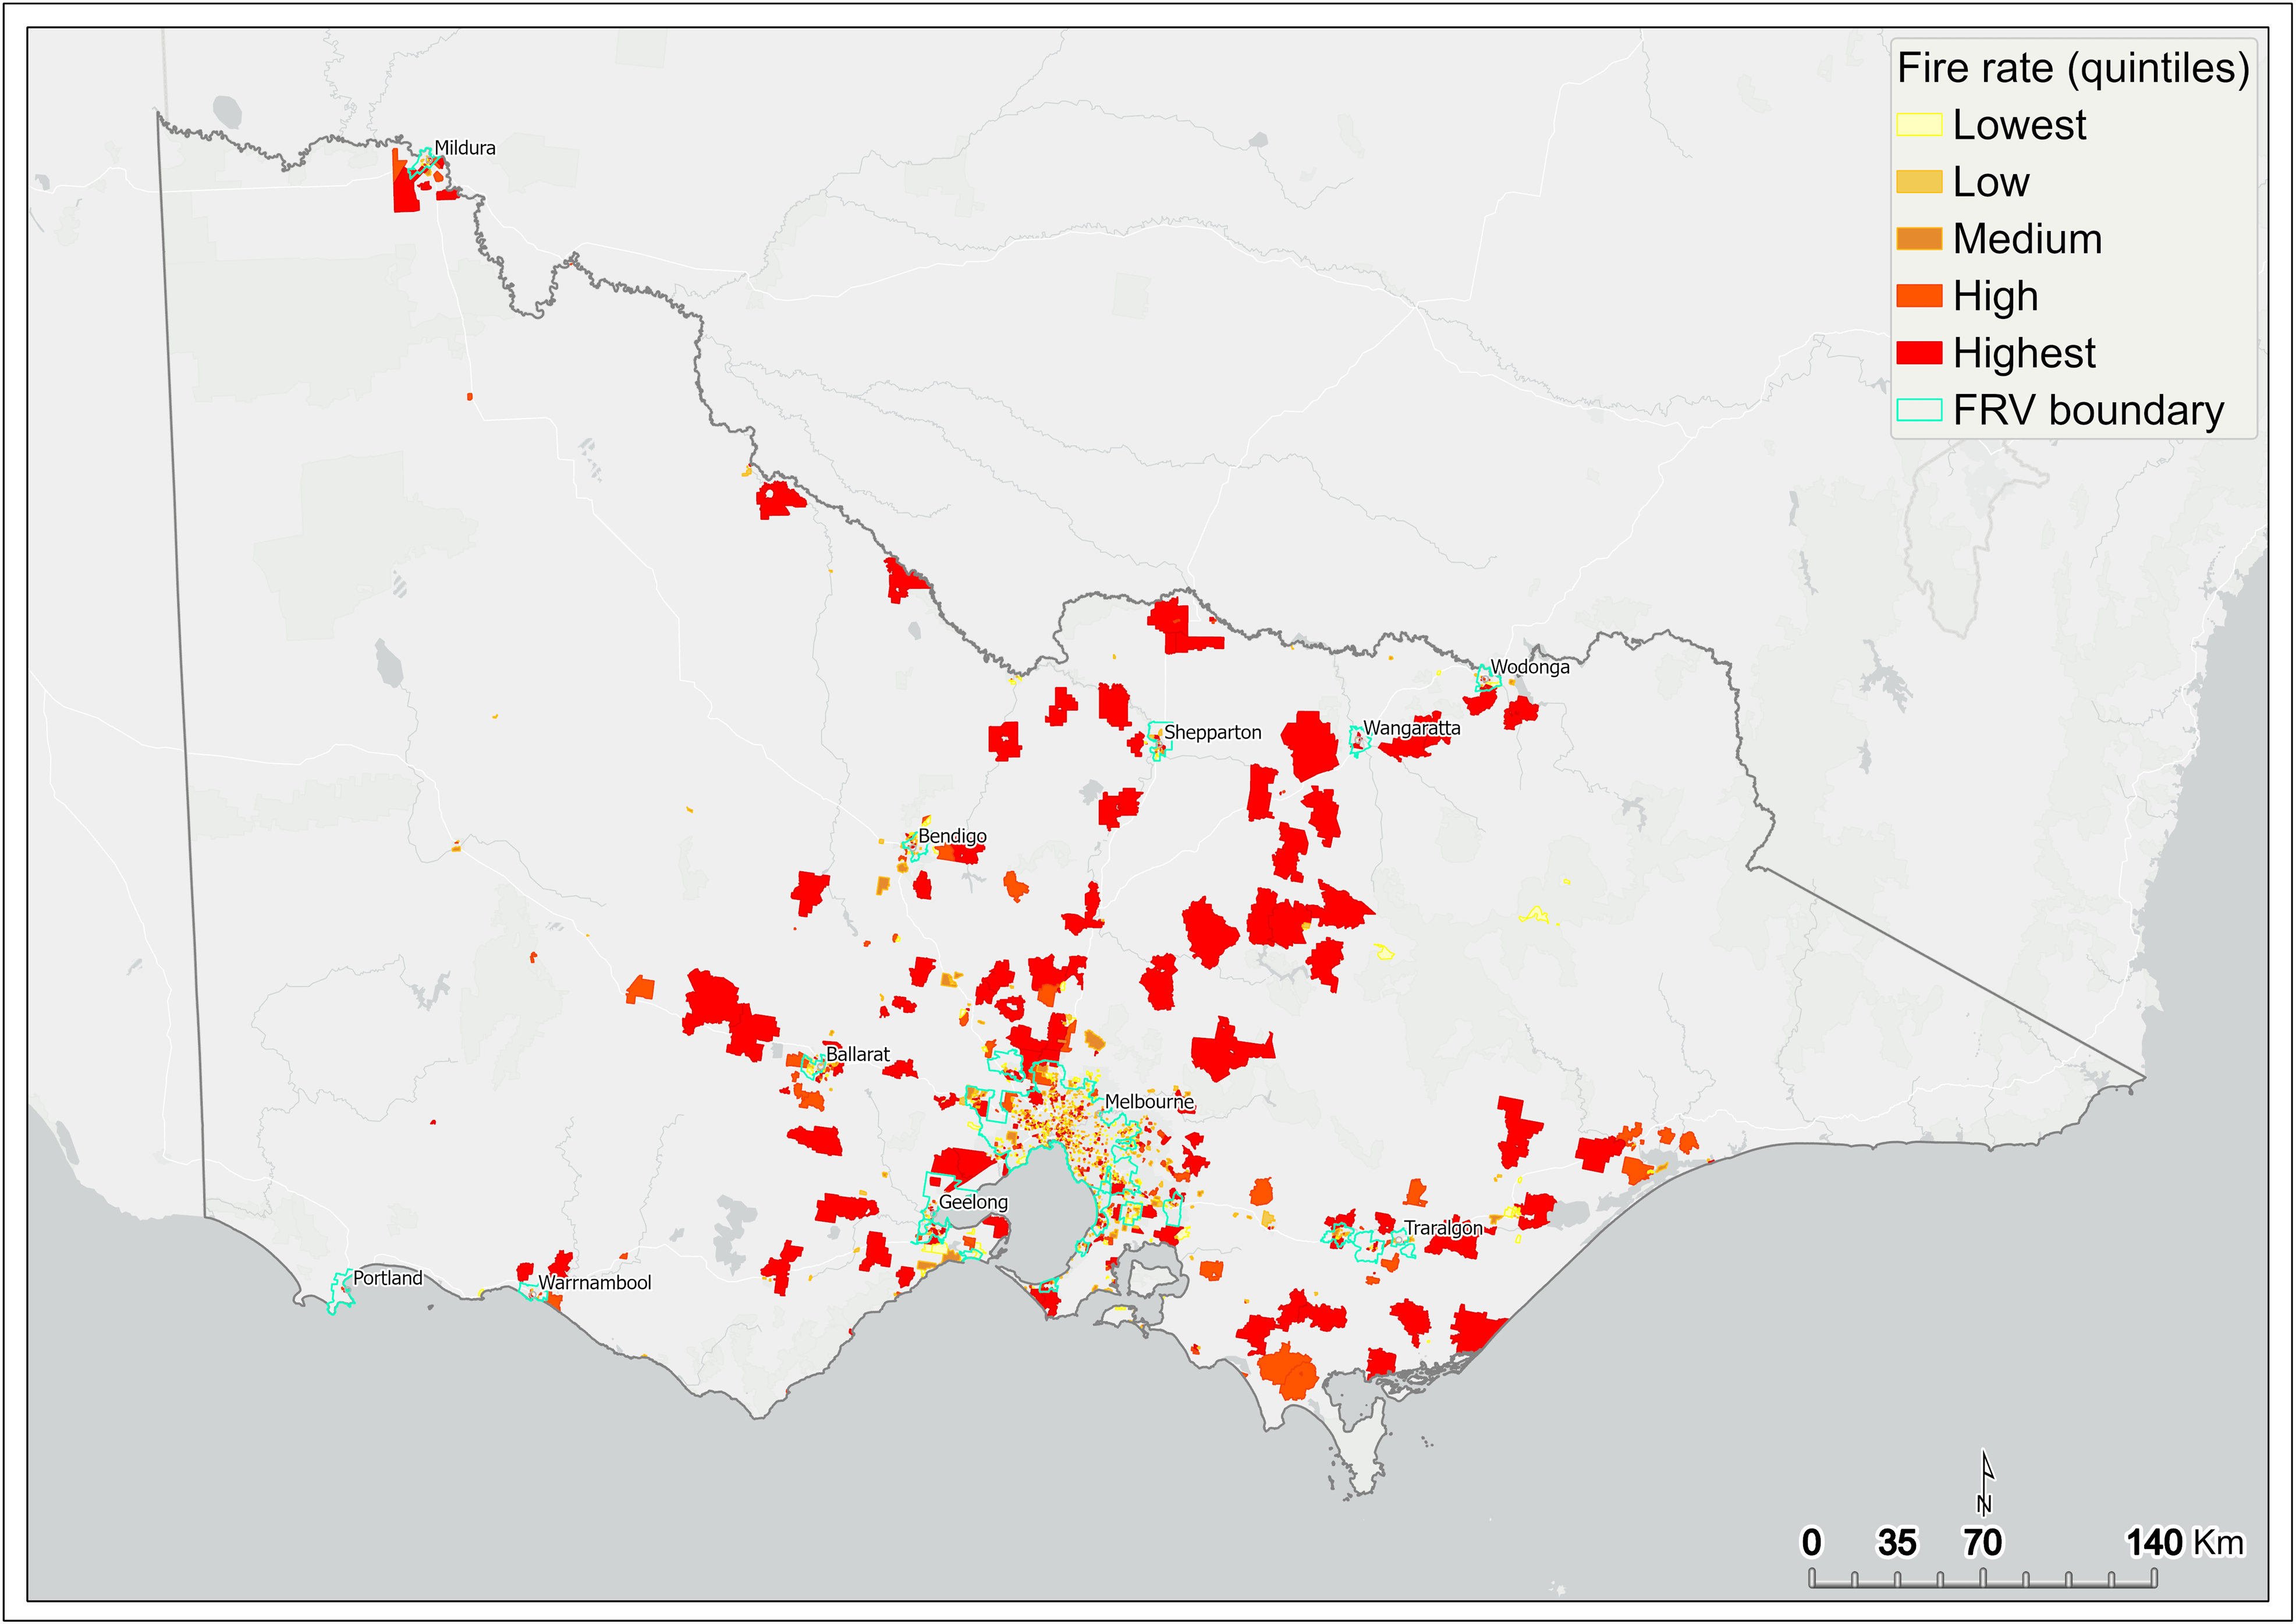
Figure 5 Fire rate per 1,000 people (quintiles) – metropolitan Melbourne
2.4.3 Hot spot analysis
Hot spot analysis, also known as Getis-Ord Gi* (G-I-star) statistics, identifies locations of statistically significant3 clusters of high values (hot spots) and low values (cold spots). This work focused on the statistically significant hot spots, using the fire rate (per 1,000 people) across SA1 of Victoria.
The hot spot analysis returns a z-score and a p-value for each polygon.
- The p-value is a probability.
- Z-scores are standard deviations.
- A high z-score and a low p-value for a feature indicates a significant hot spot.
- The higher the z-score (or lower if negative), the more intense the clustering.
For statistically significant positive z-scores, the larger the z-score, the more intense the clustering of high values (hot spot). - A z-score near zero means no spatial clustering.
A key step in the spatial hot spot analysis is selecting an appropriate distance threshold (or band) for analysis. For this, an incremental spatial autocorrelation test was used. Drawing on the Global Moran’s I Index value (0.032533), an appropriate distance threshold of 1,500 m was selected using an associated zscore of 9.475181 and a p-value of 0.000000.
To validate the results obtained from the hot spot analysis, a spatial autocorrelation test was used to determine whether the pattern observed from the hot spot analysis could be the result of random chance. The spatial autocorrelation report, which has a Moran′s Index value of 0.397936, identified significant positive clustering of fires at a global level across the study area (z = 115.417437, p = 0.000000).
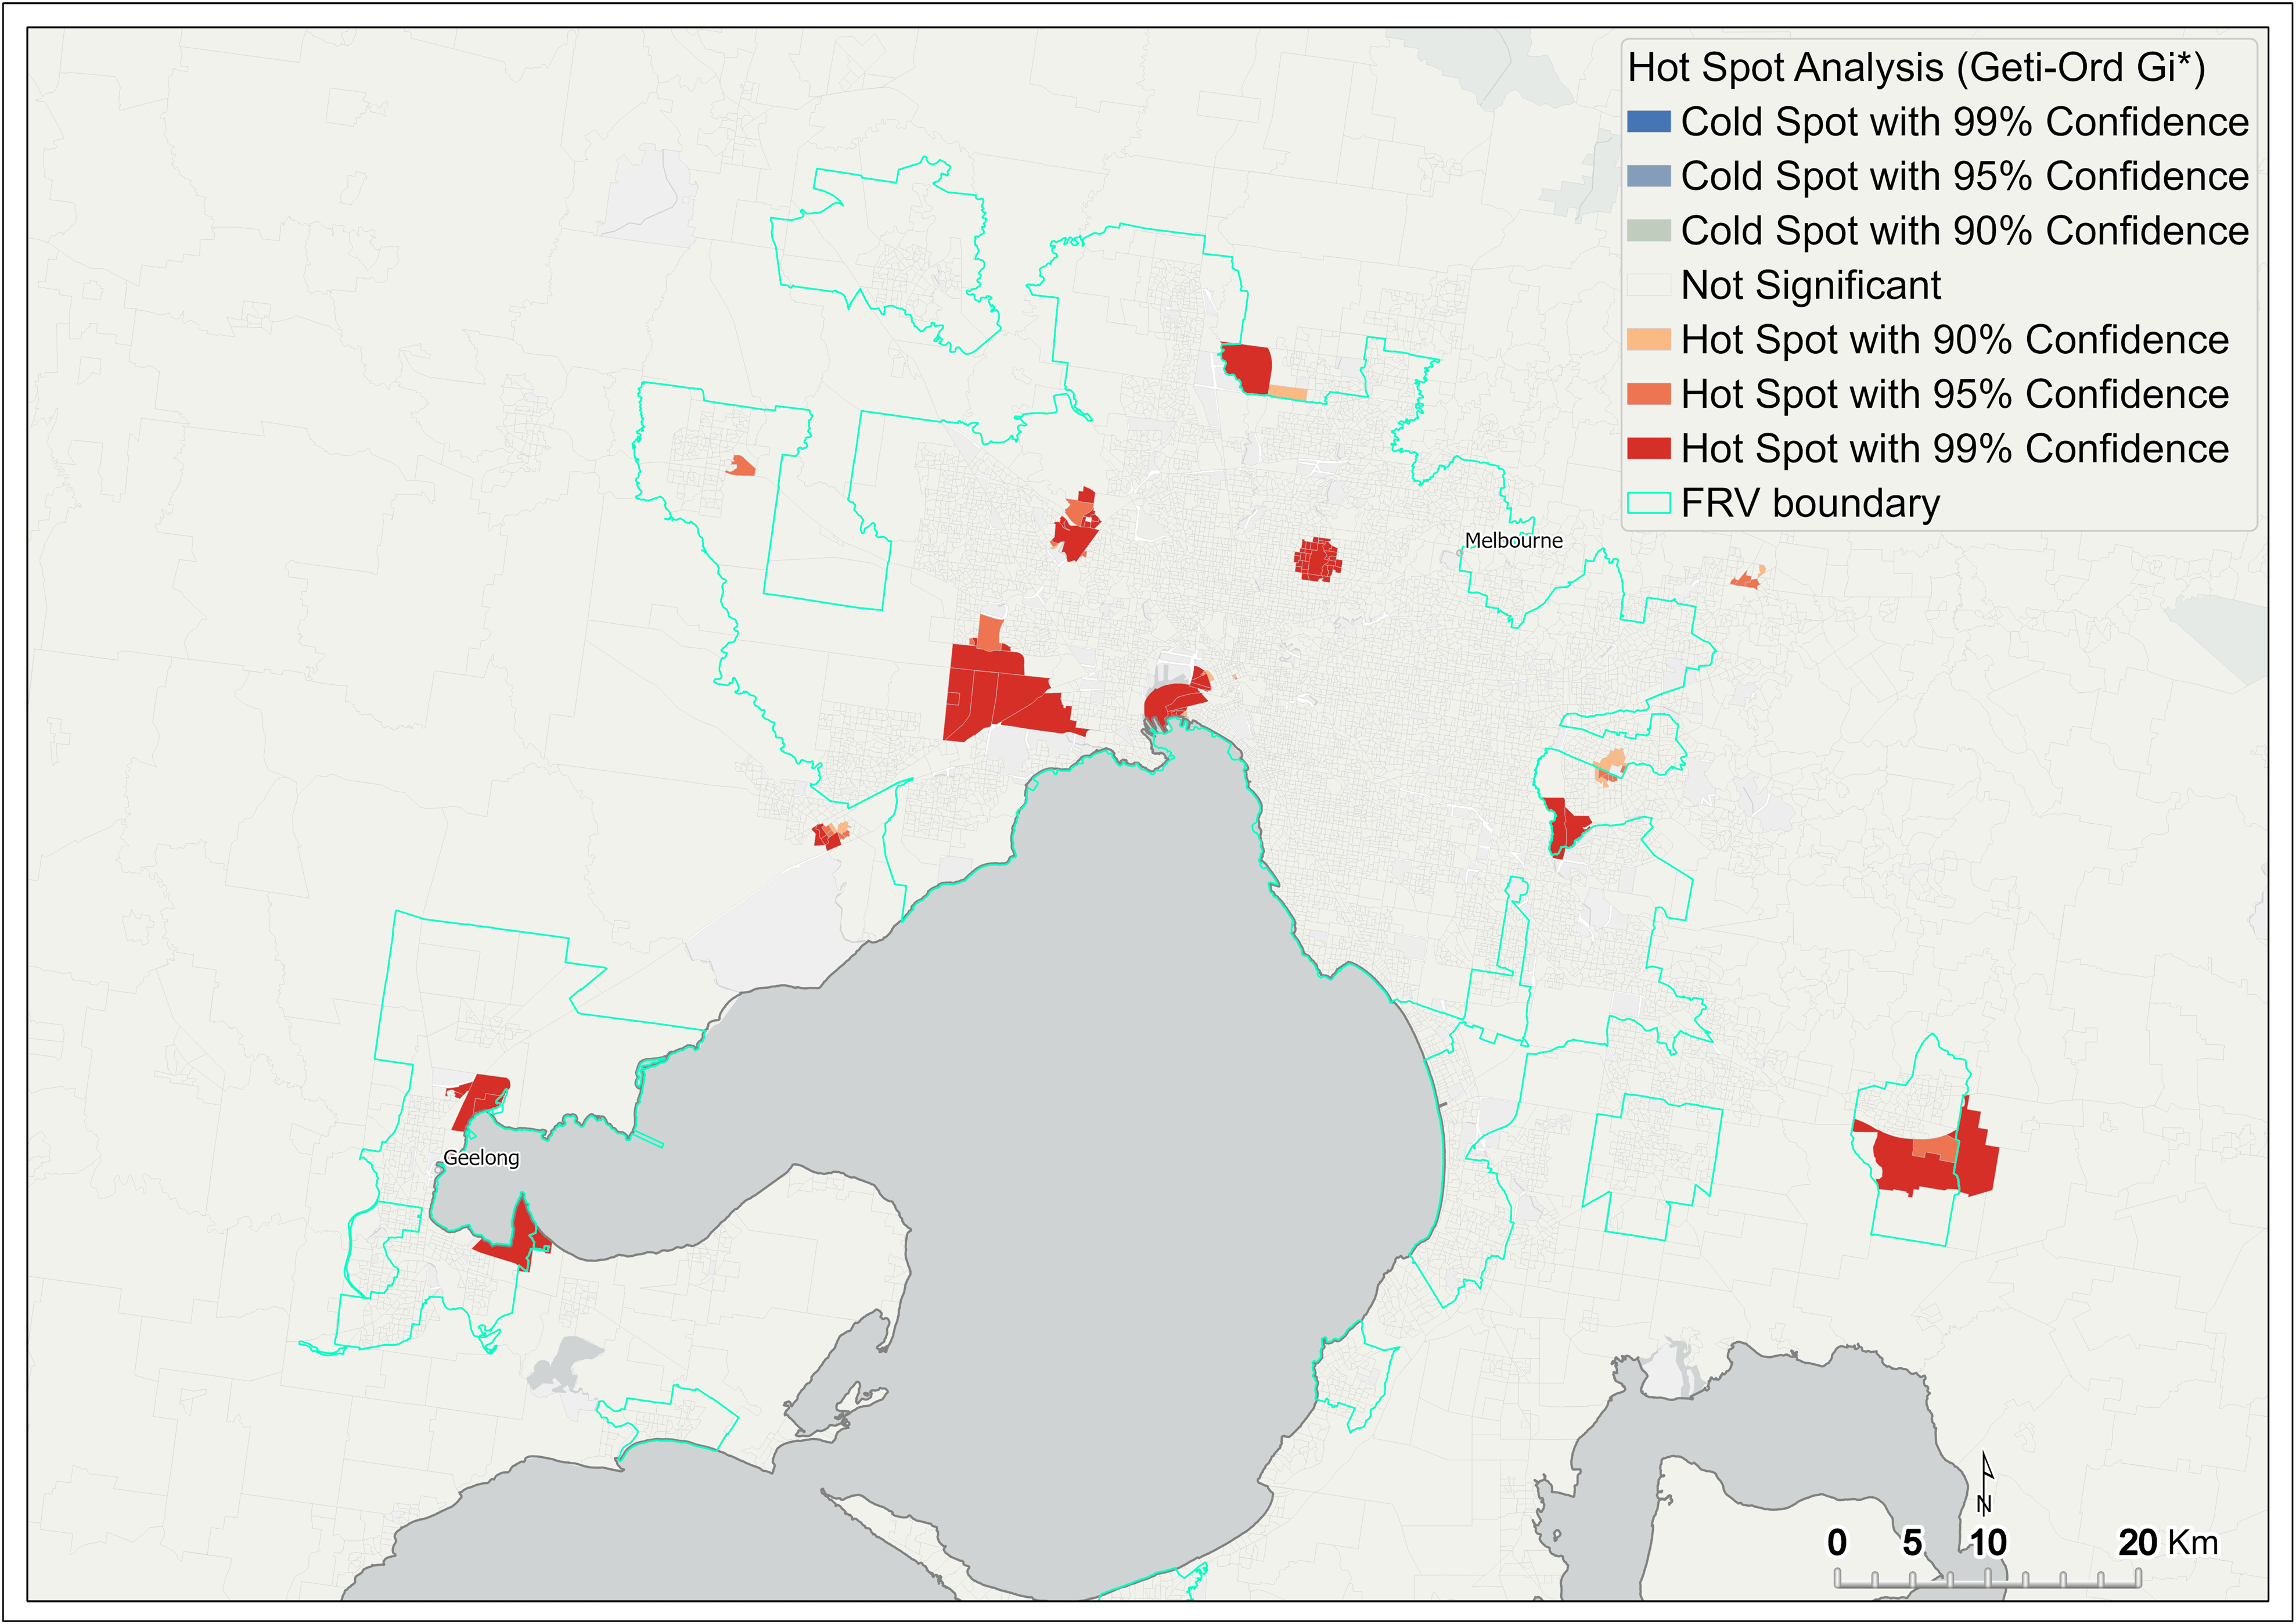
The output of the analysis shows that features of high values cluster spatially. Figure 6 shows hot spots with 99 per cent confidence interval in red; these are mainly concentrated in and around metropolitan Melbourne. On Melbourne’s outskirts, significant hot spots are seen in Geelong and Pakenham (Figure 7). In the regions, significant hot spots are only seen in the north of the state, around Wangaratta and Wodonga (Figure 6).
Figure 6 Hot spot analysis of fire rate – statewide
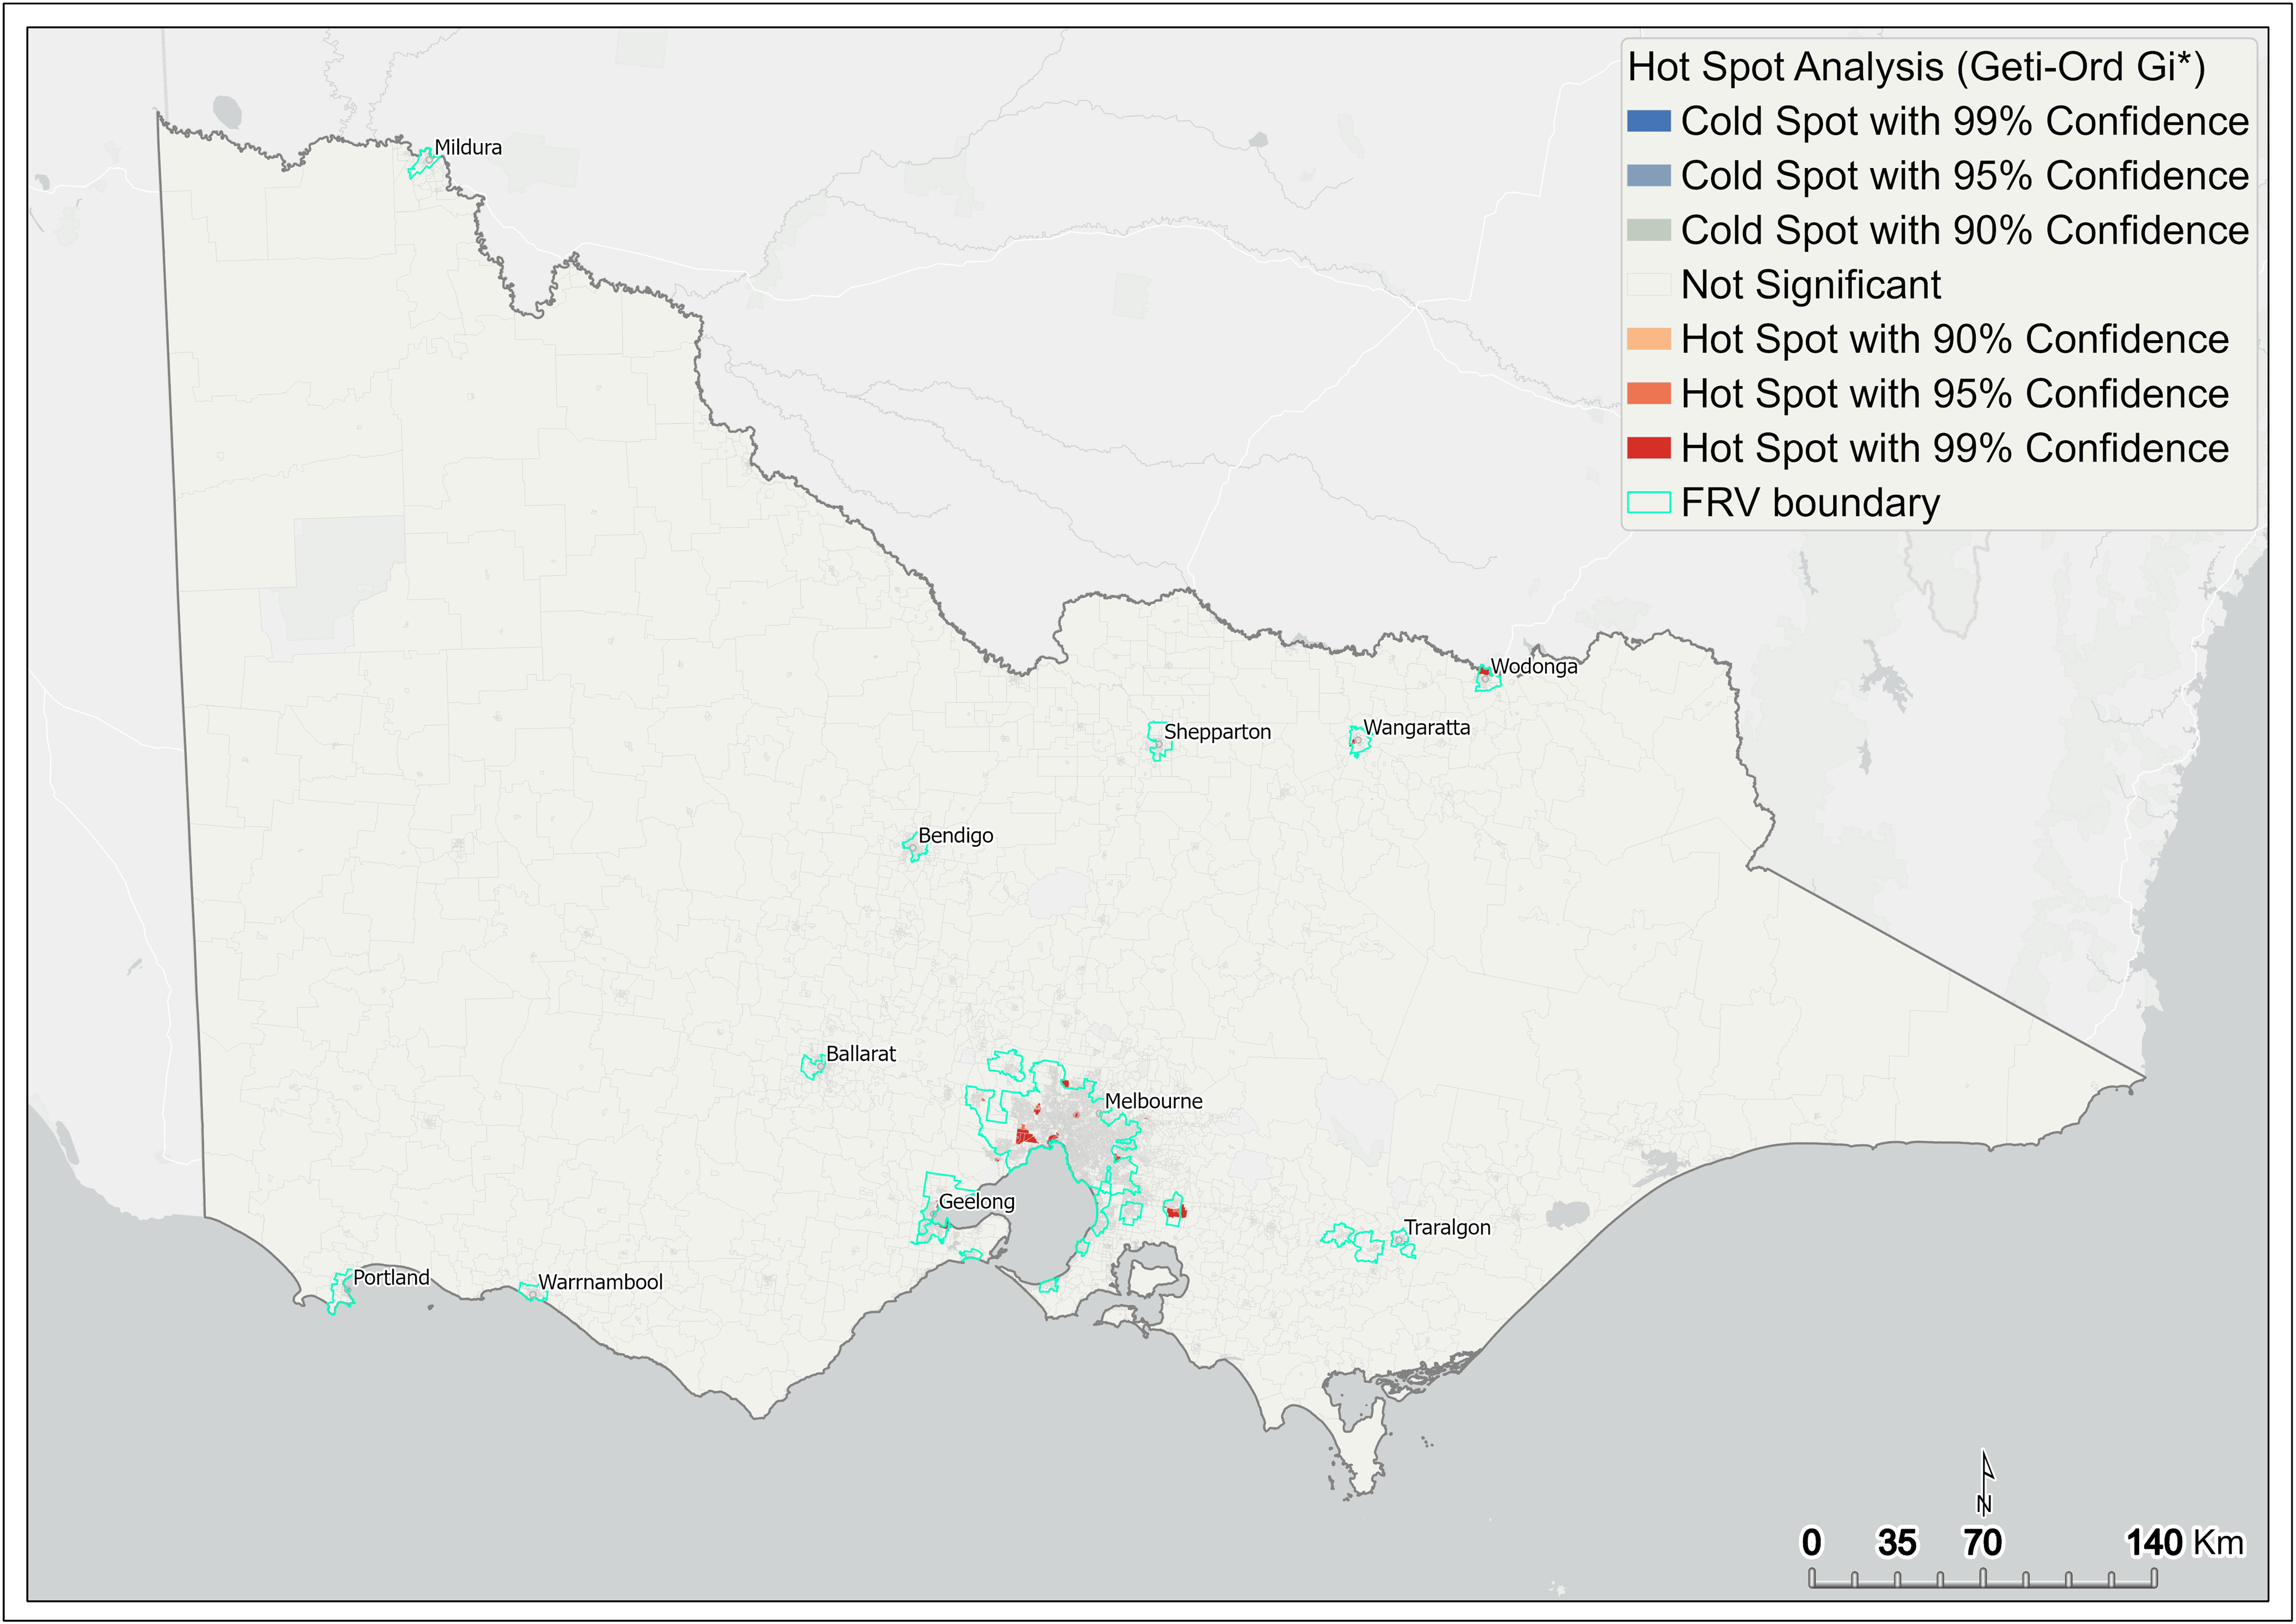
Figure 7 Hot spot analysis of fire rate – metropolitan Melbourne
2.4.4 Kernel density estimation
In this review, the kernel density estimation (KDE) technique was used to highlight the spatial variability of both fire incidents and MVAs across Victoria. The KDE map identifies areas exhibiting high concentrations of these incidents, also known as ‘hot spots’ in contrast to those displaying lower incidence levels.
While the previous techniques (fire rate and hot spot analysis) are constrained by using SA1 boundaries, KDE analysis is computed to identify areas exhibiting high incident intensity independent of any geographical boundary. The raster output from the KDE (classified values) analysis is converted into vector format (using a common scale, SA1) to facilitate input into the initial DSA.
A key factor in the use of KDE is the selection of an appropriate distance band (bandwidth or threshold). This bandwidth determines the search radius that the KDE technique employs. A larger bandwidth produces a smoother, more generalised density output, while a very small one produces a more detailed output. After testing a range of bandwidths, 1,000 m was selected to compute the KDE of fire incidents and MVAs.
Figure 8 shows the KDE of fire incidents captured at the SA1 scale across Victoria. Results show that the intensity of fire is highest in Melbourne’s CBD and many of the inner-city suburbs (Figure 9). Intensity is also high in many of the larger regional centres, such as Ballarat, Bendigo, Geelong, Mildura, Albury, and Shepparton (Figure 8).
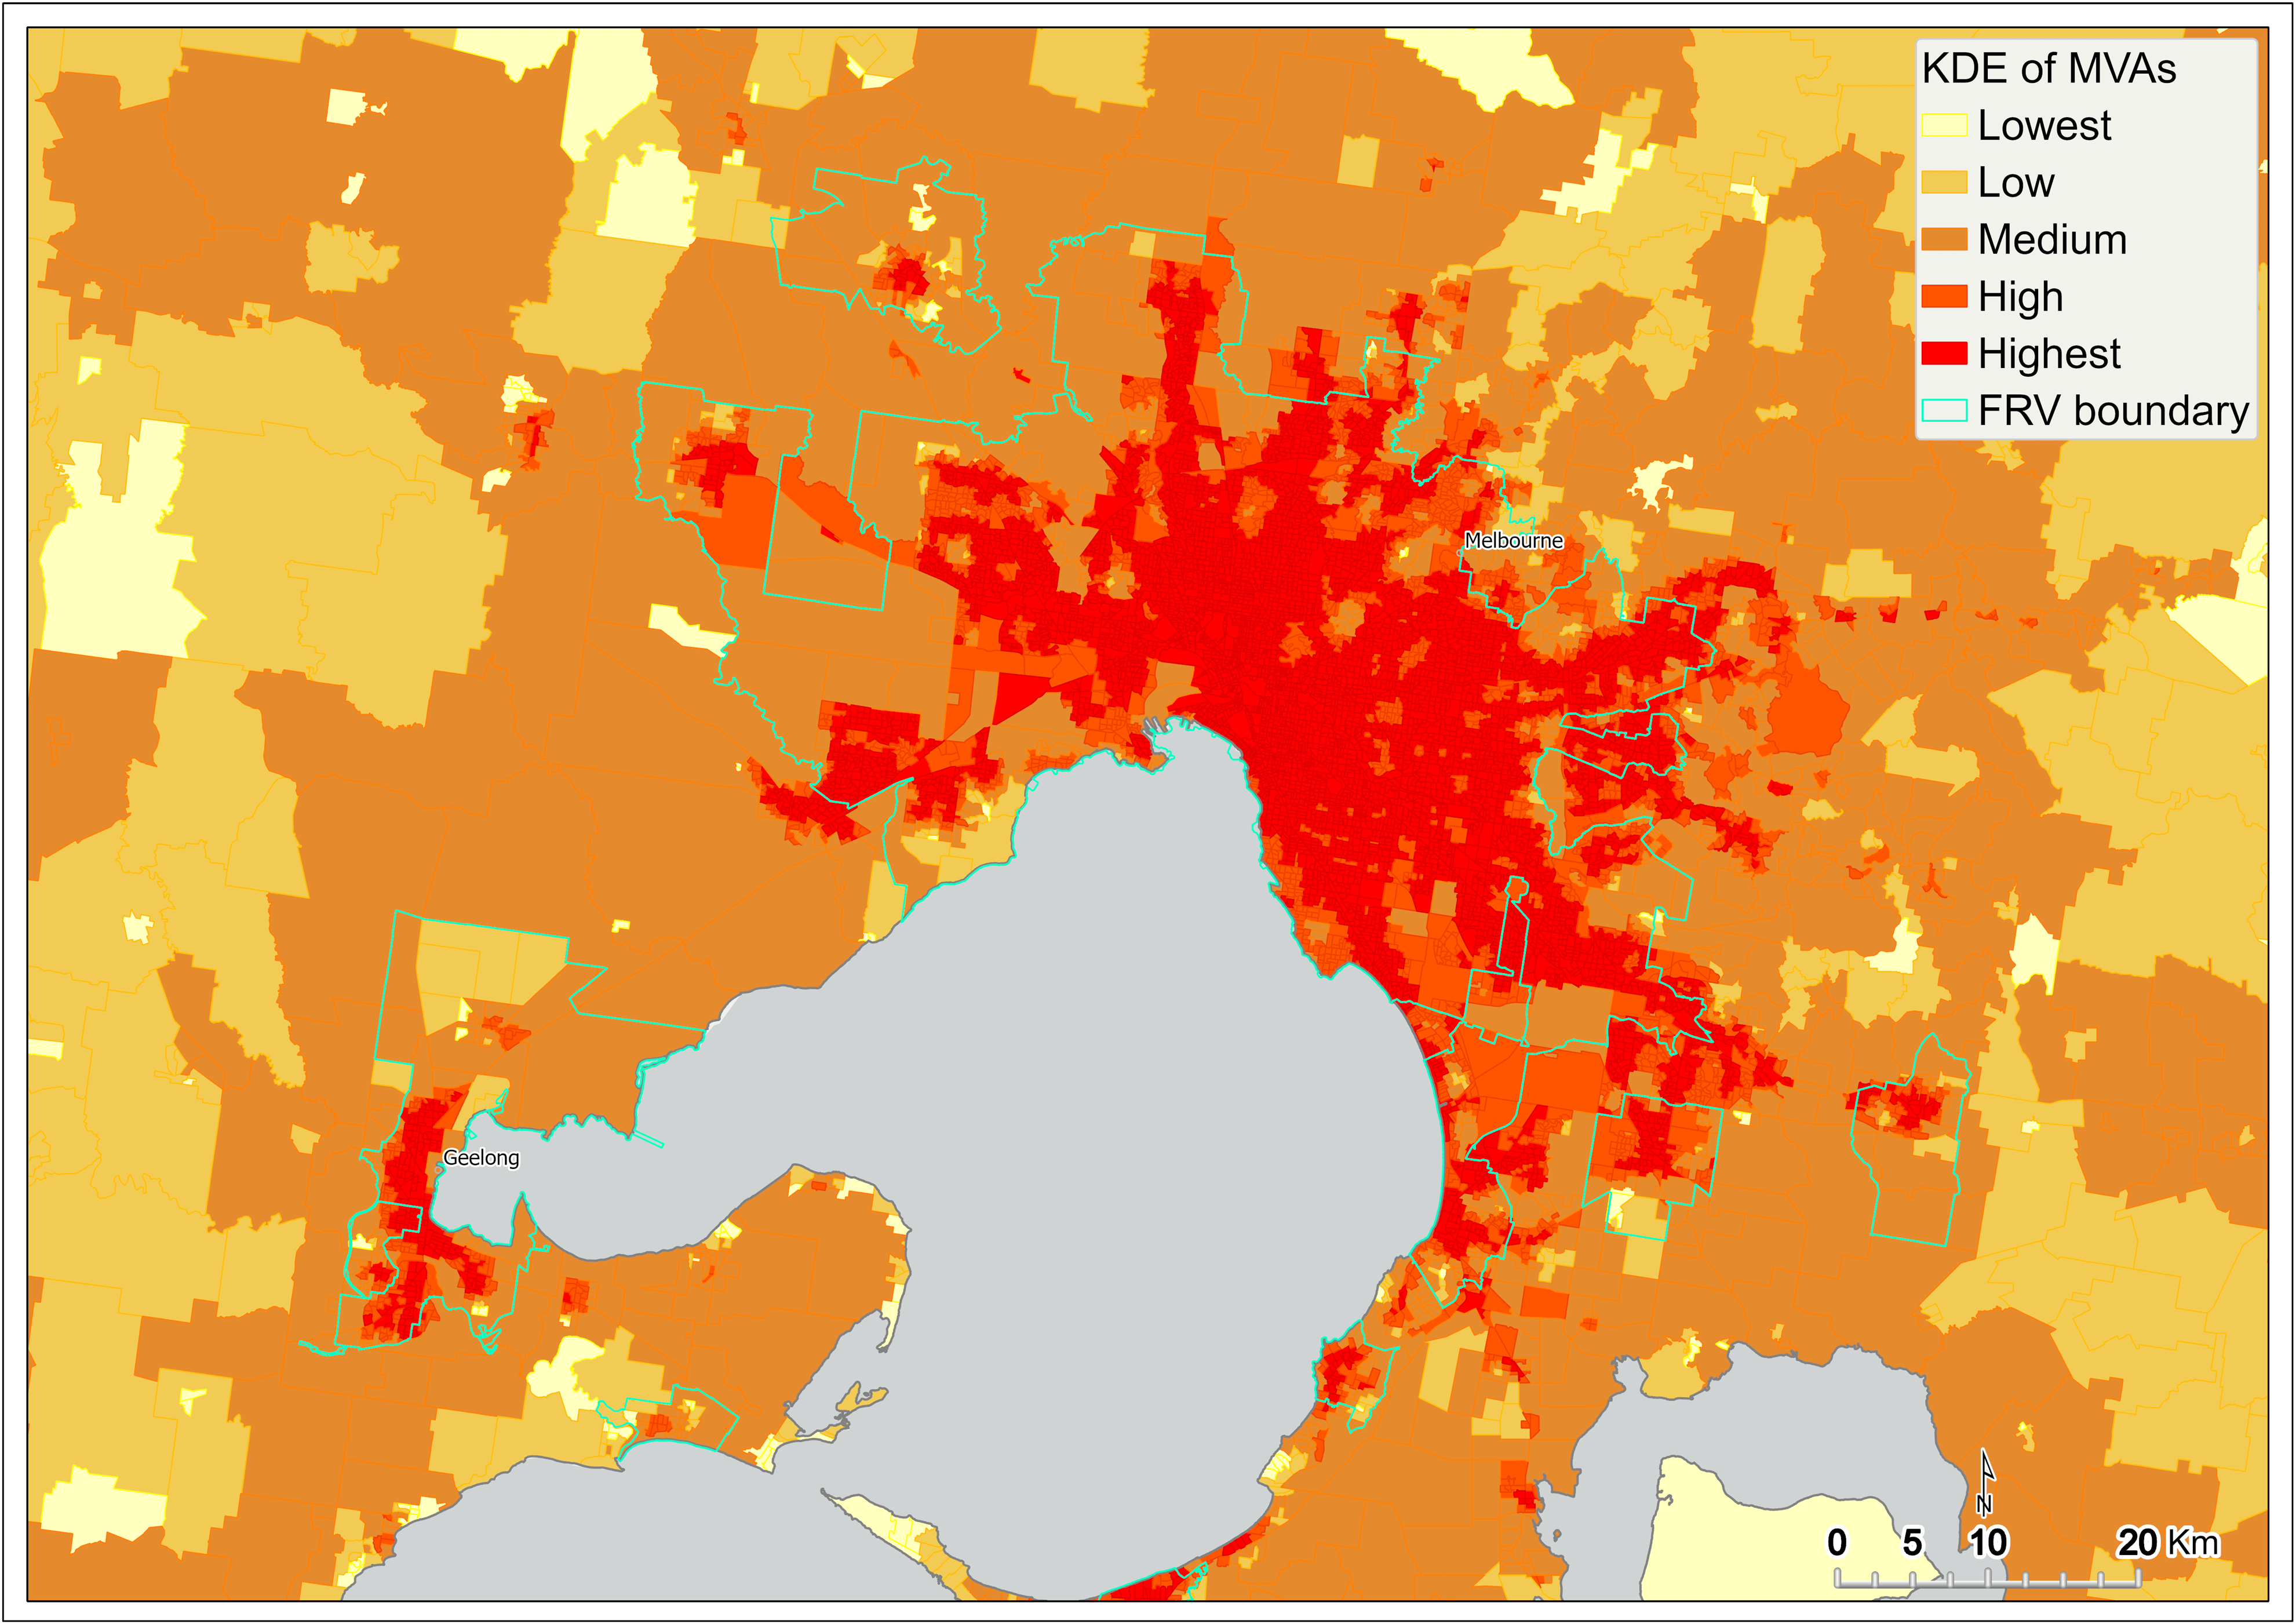
A similar pattern is exhibited by KDE of MVAs captured at the SA1 scale across Victoria (Figure 10). However, in comparison to the KDE of fire incidents, the intensity of MVAs is more pronounced within metropolitan Melbourne and surrounding areas (Figure 11). This intensity tends to track with arterial roads leading out of Melbourne (Figure 10).
Figure 8 Kernel density estimation of fire incidents by SA1 – statewide
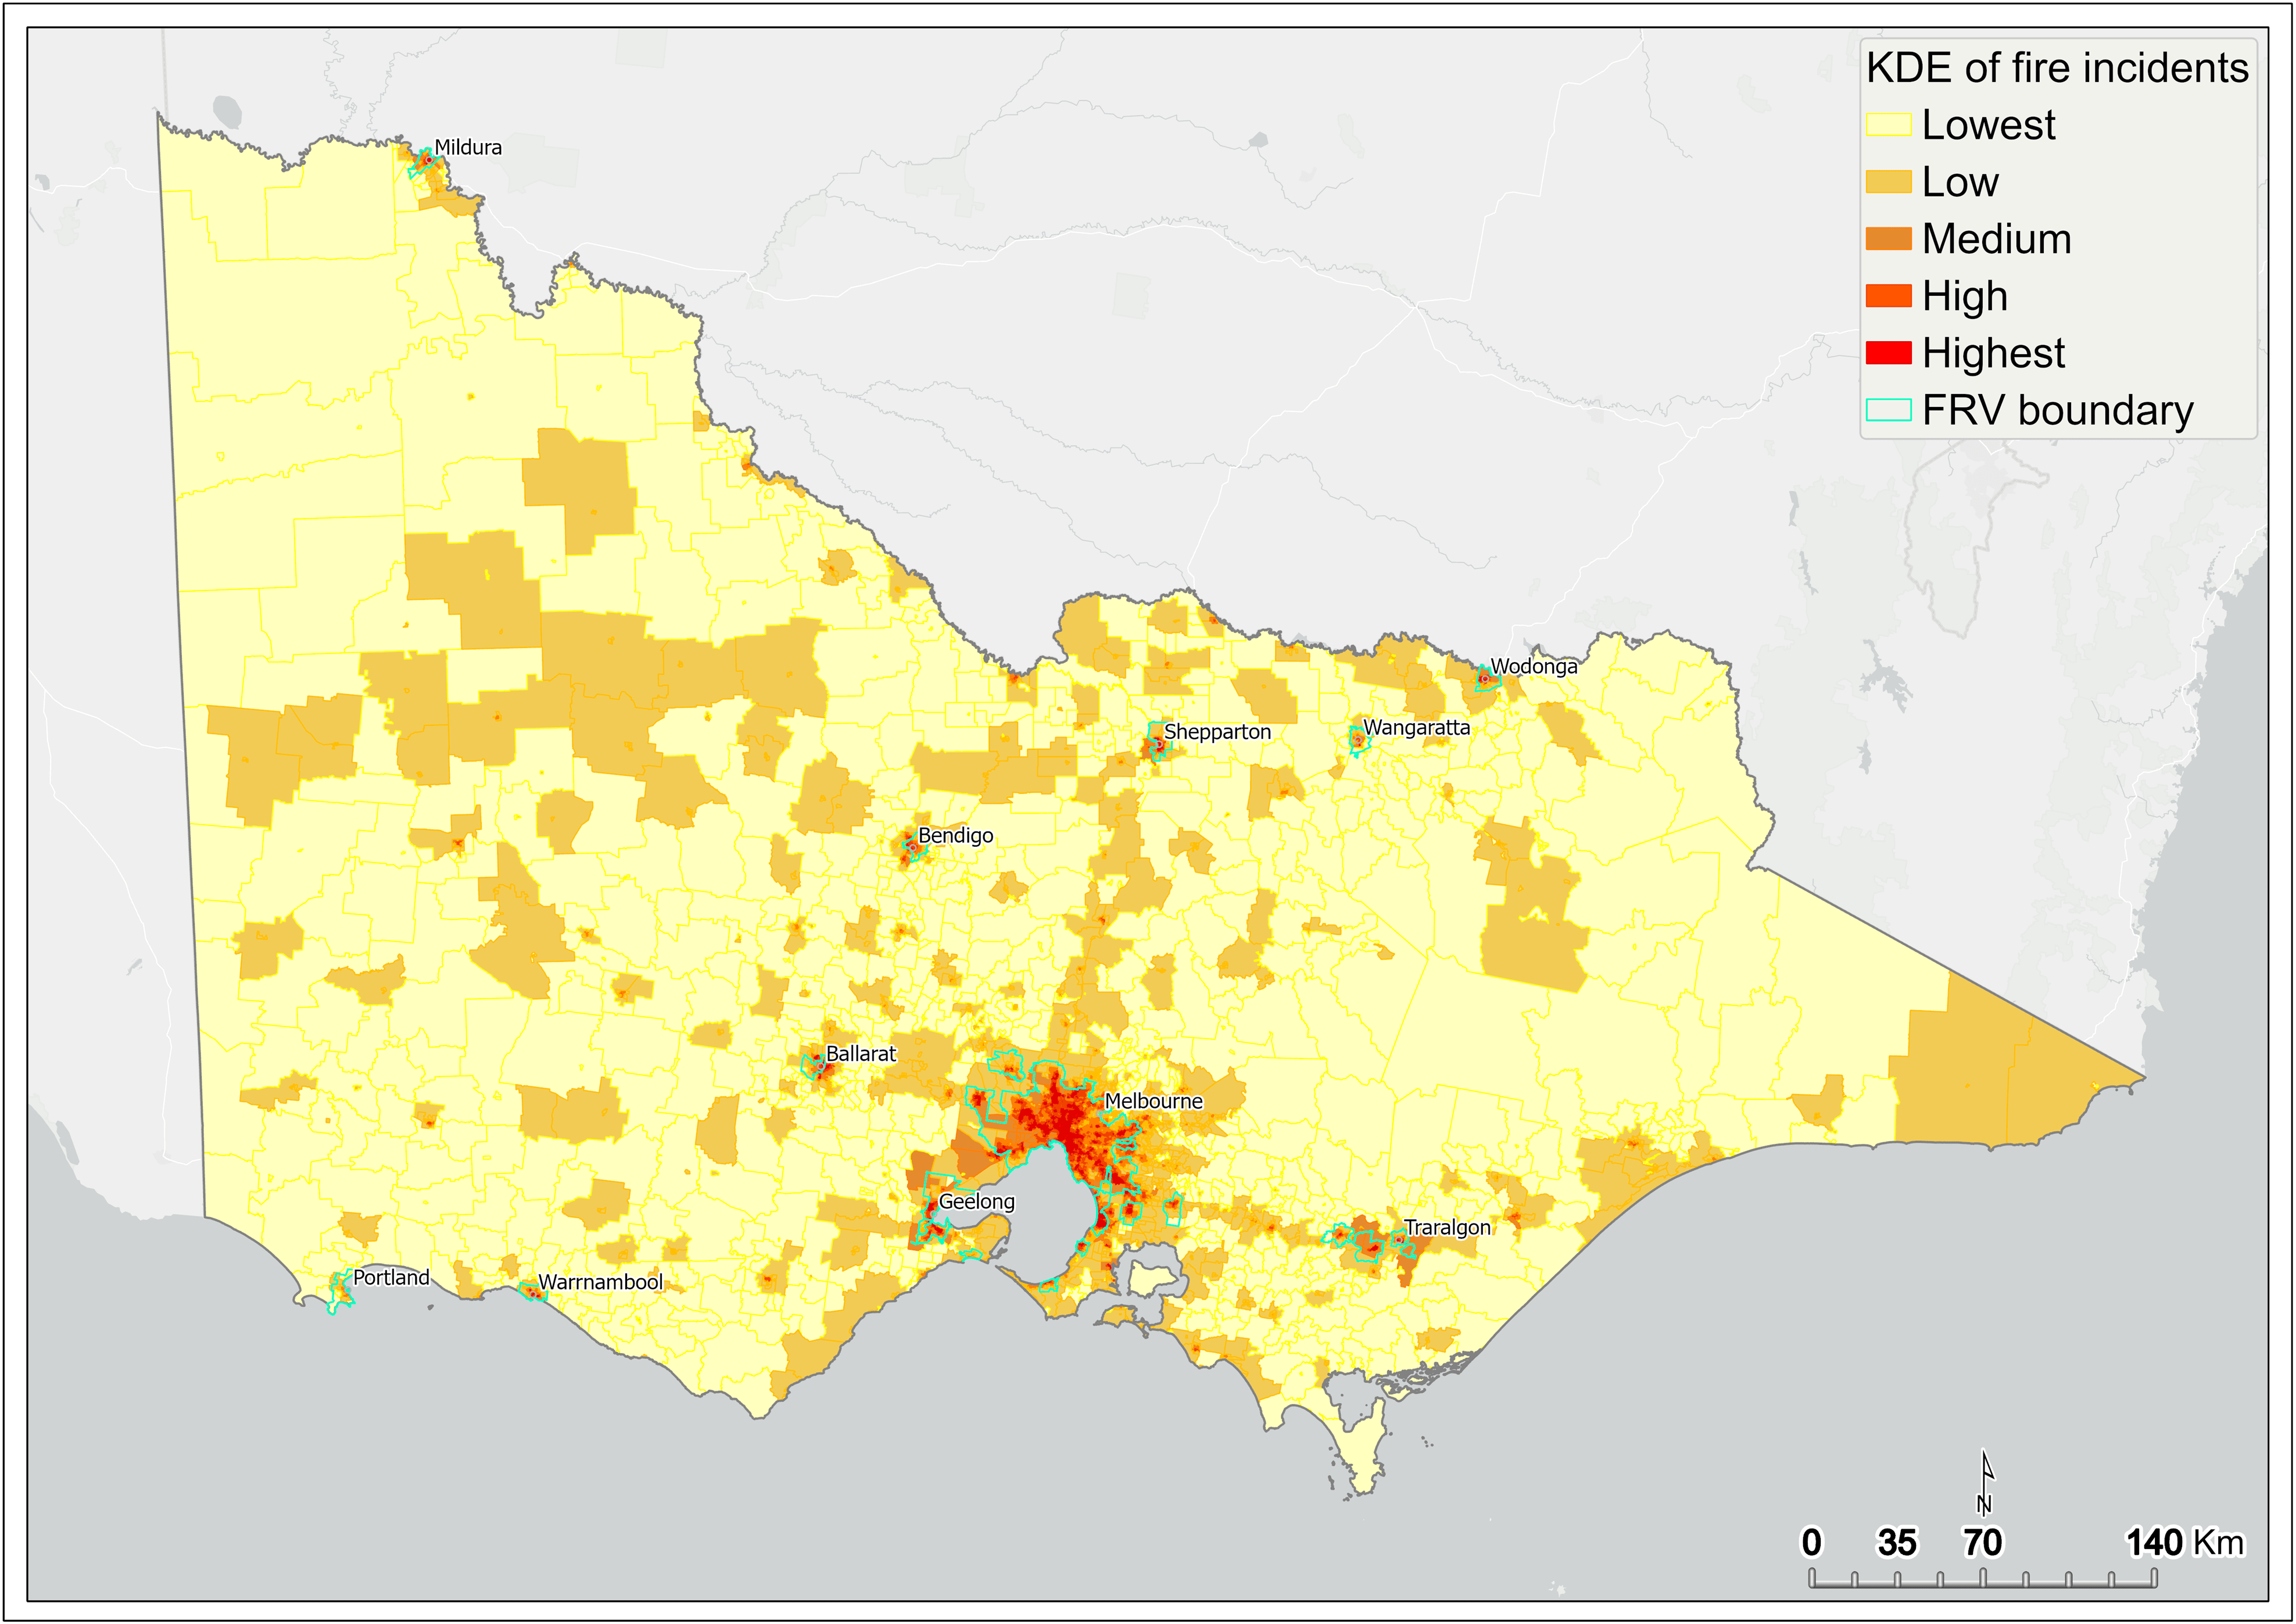
Figure 9 Kernel density estimation of fire incidents by SA1 – metropolitan Melbourne
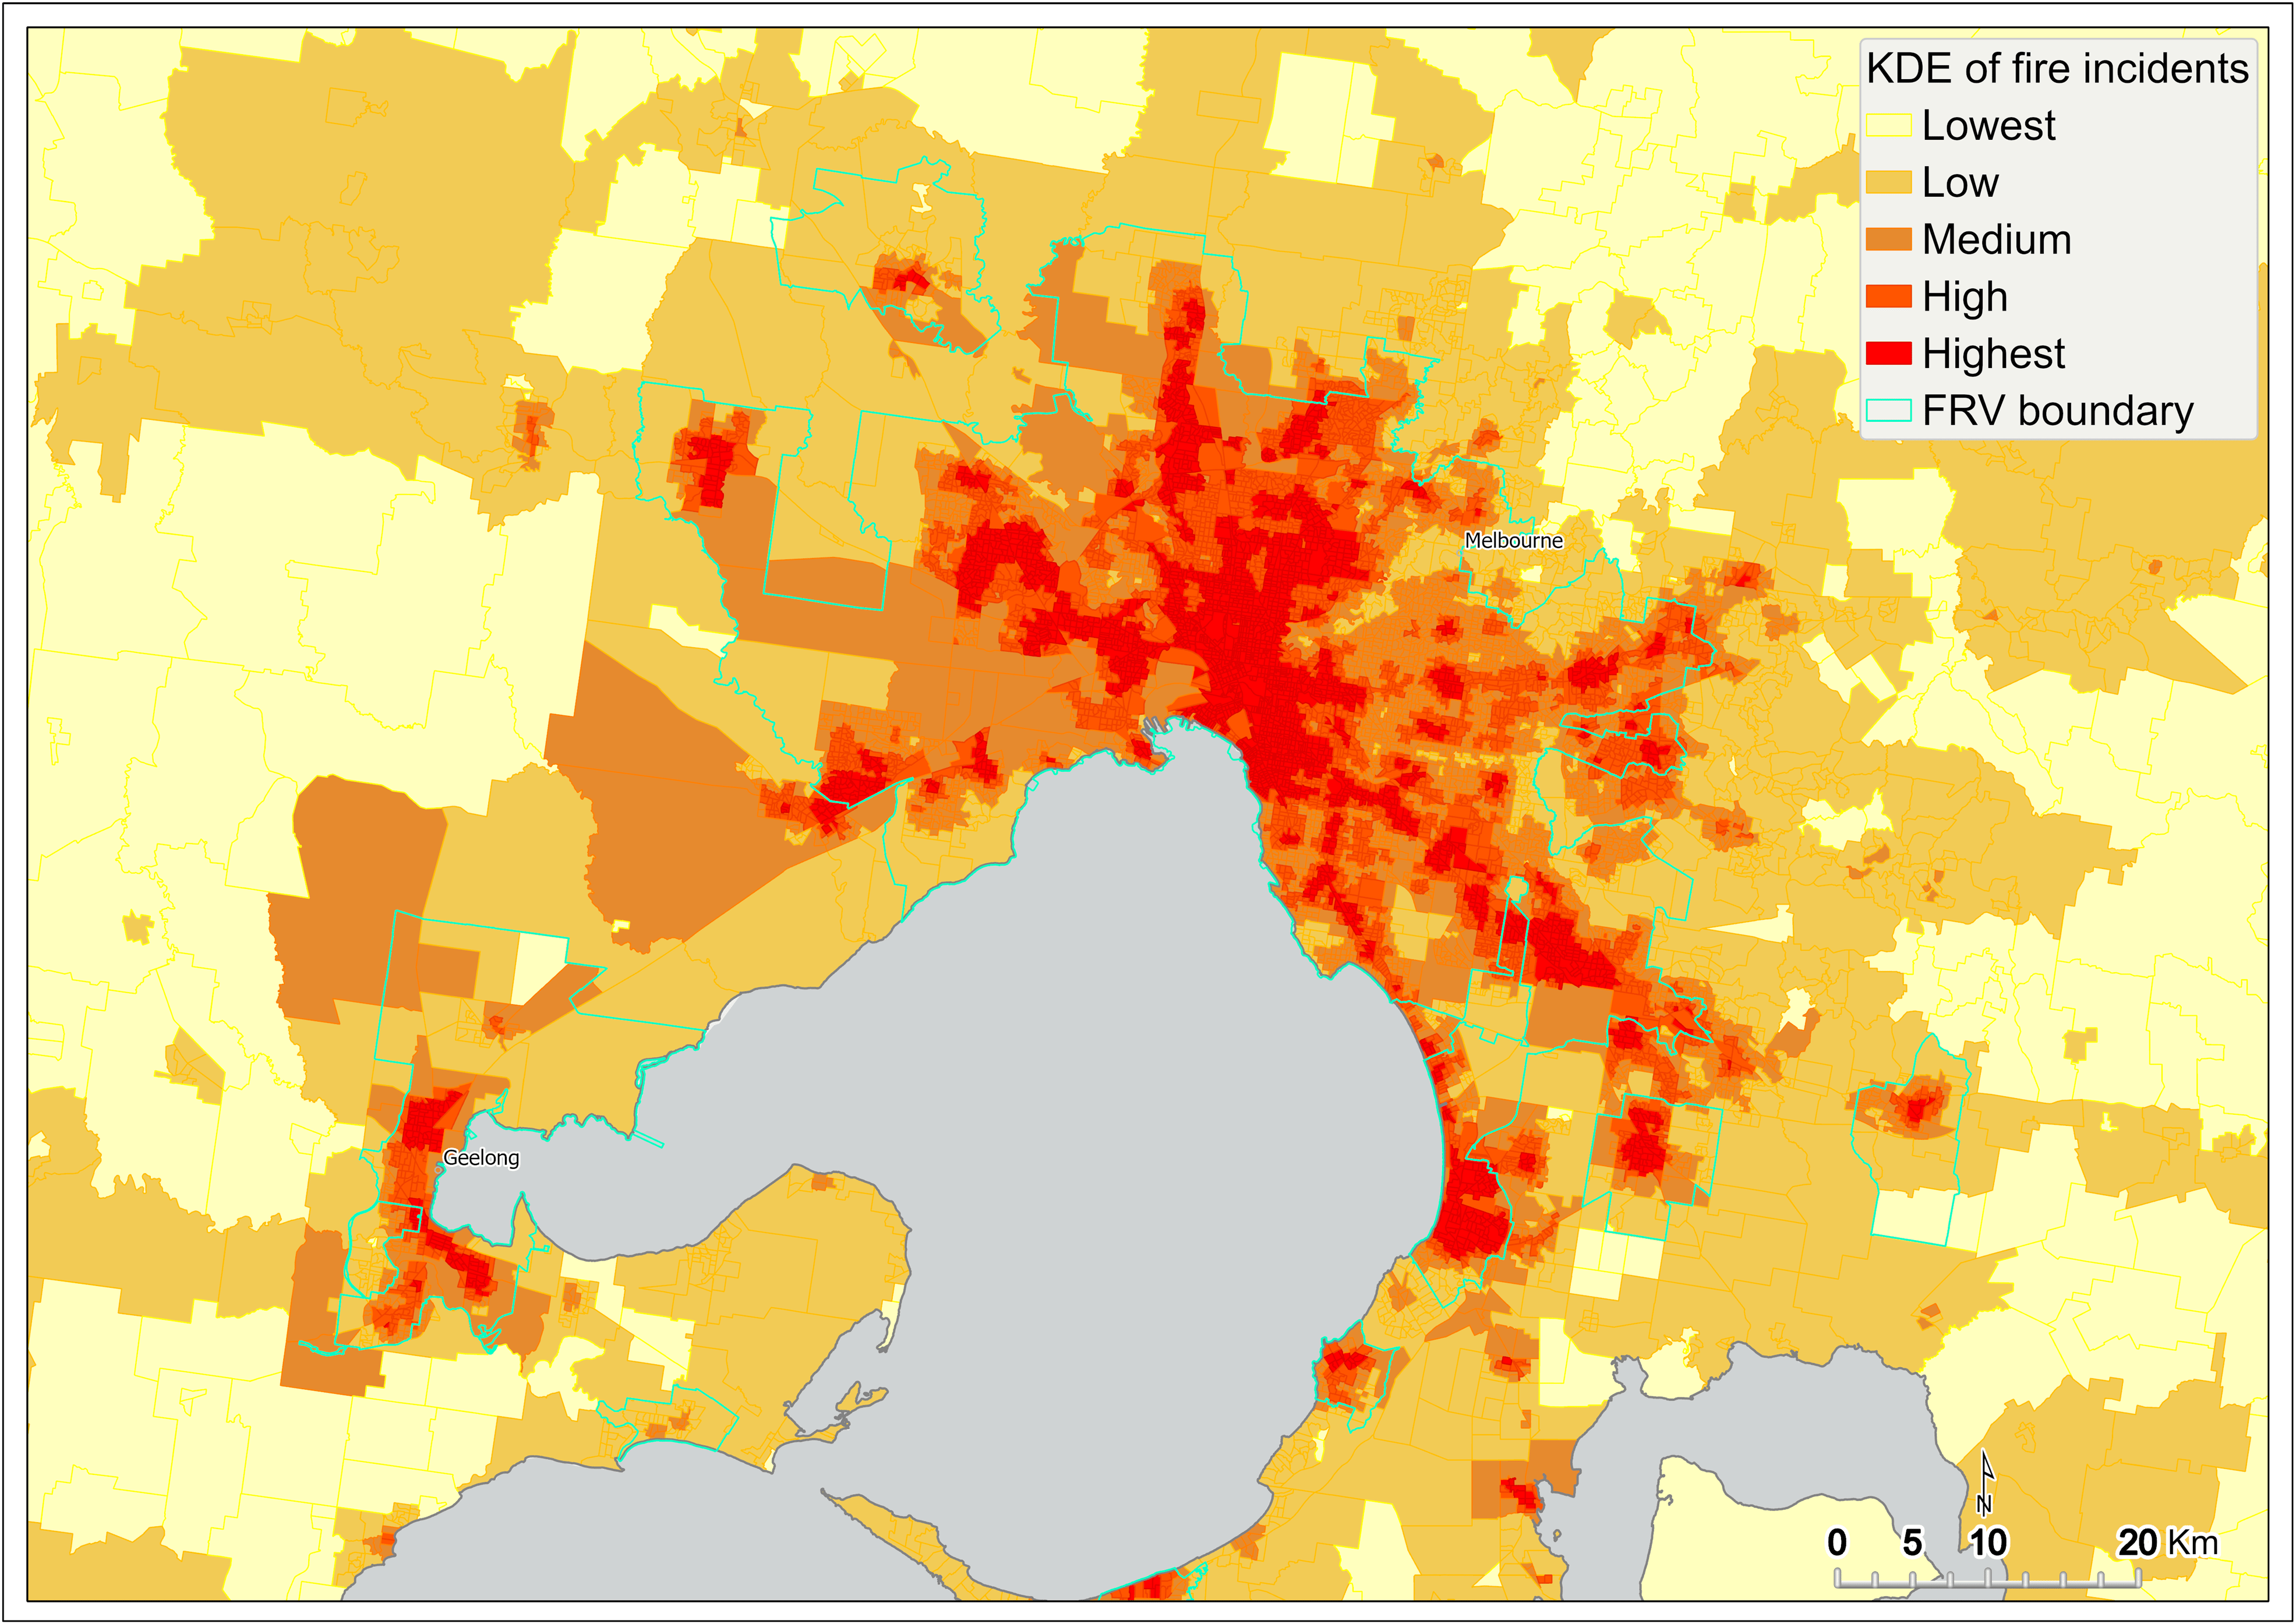
Figure 10 Kernel density estimation of motor vehicle accidents by SA1 – statewide
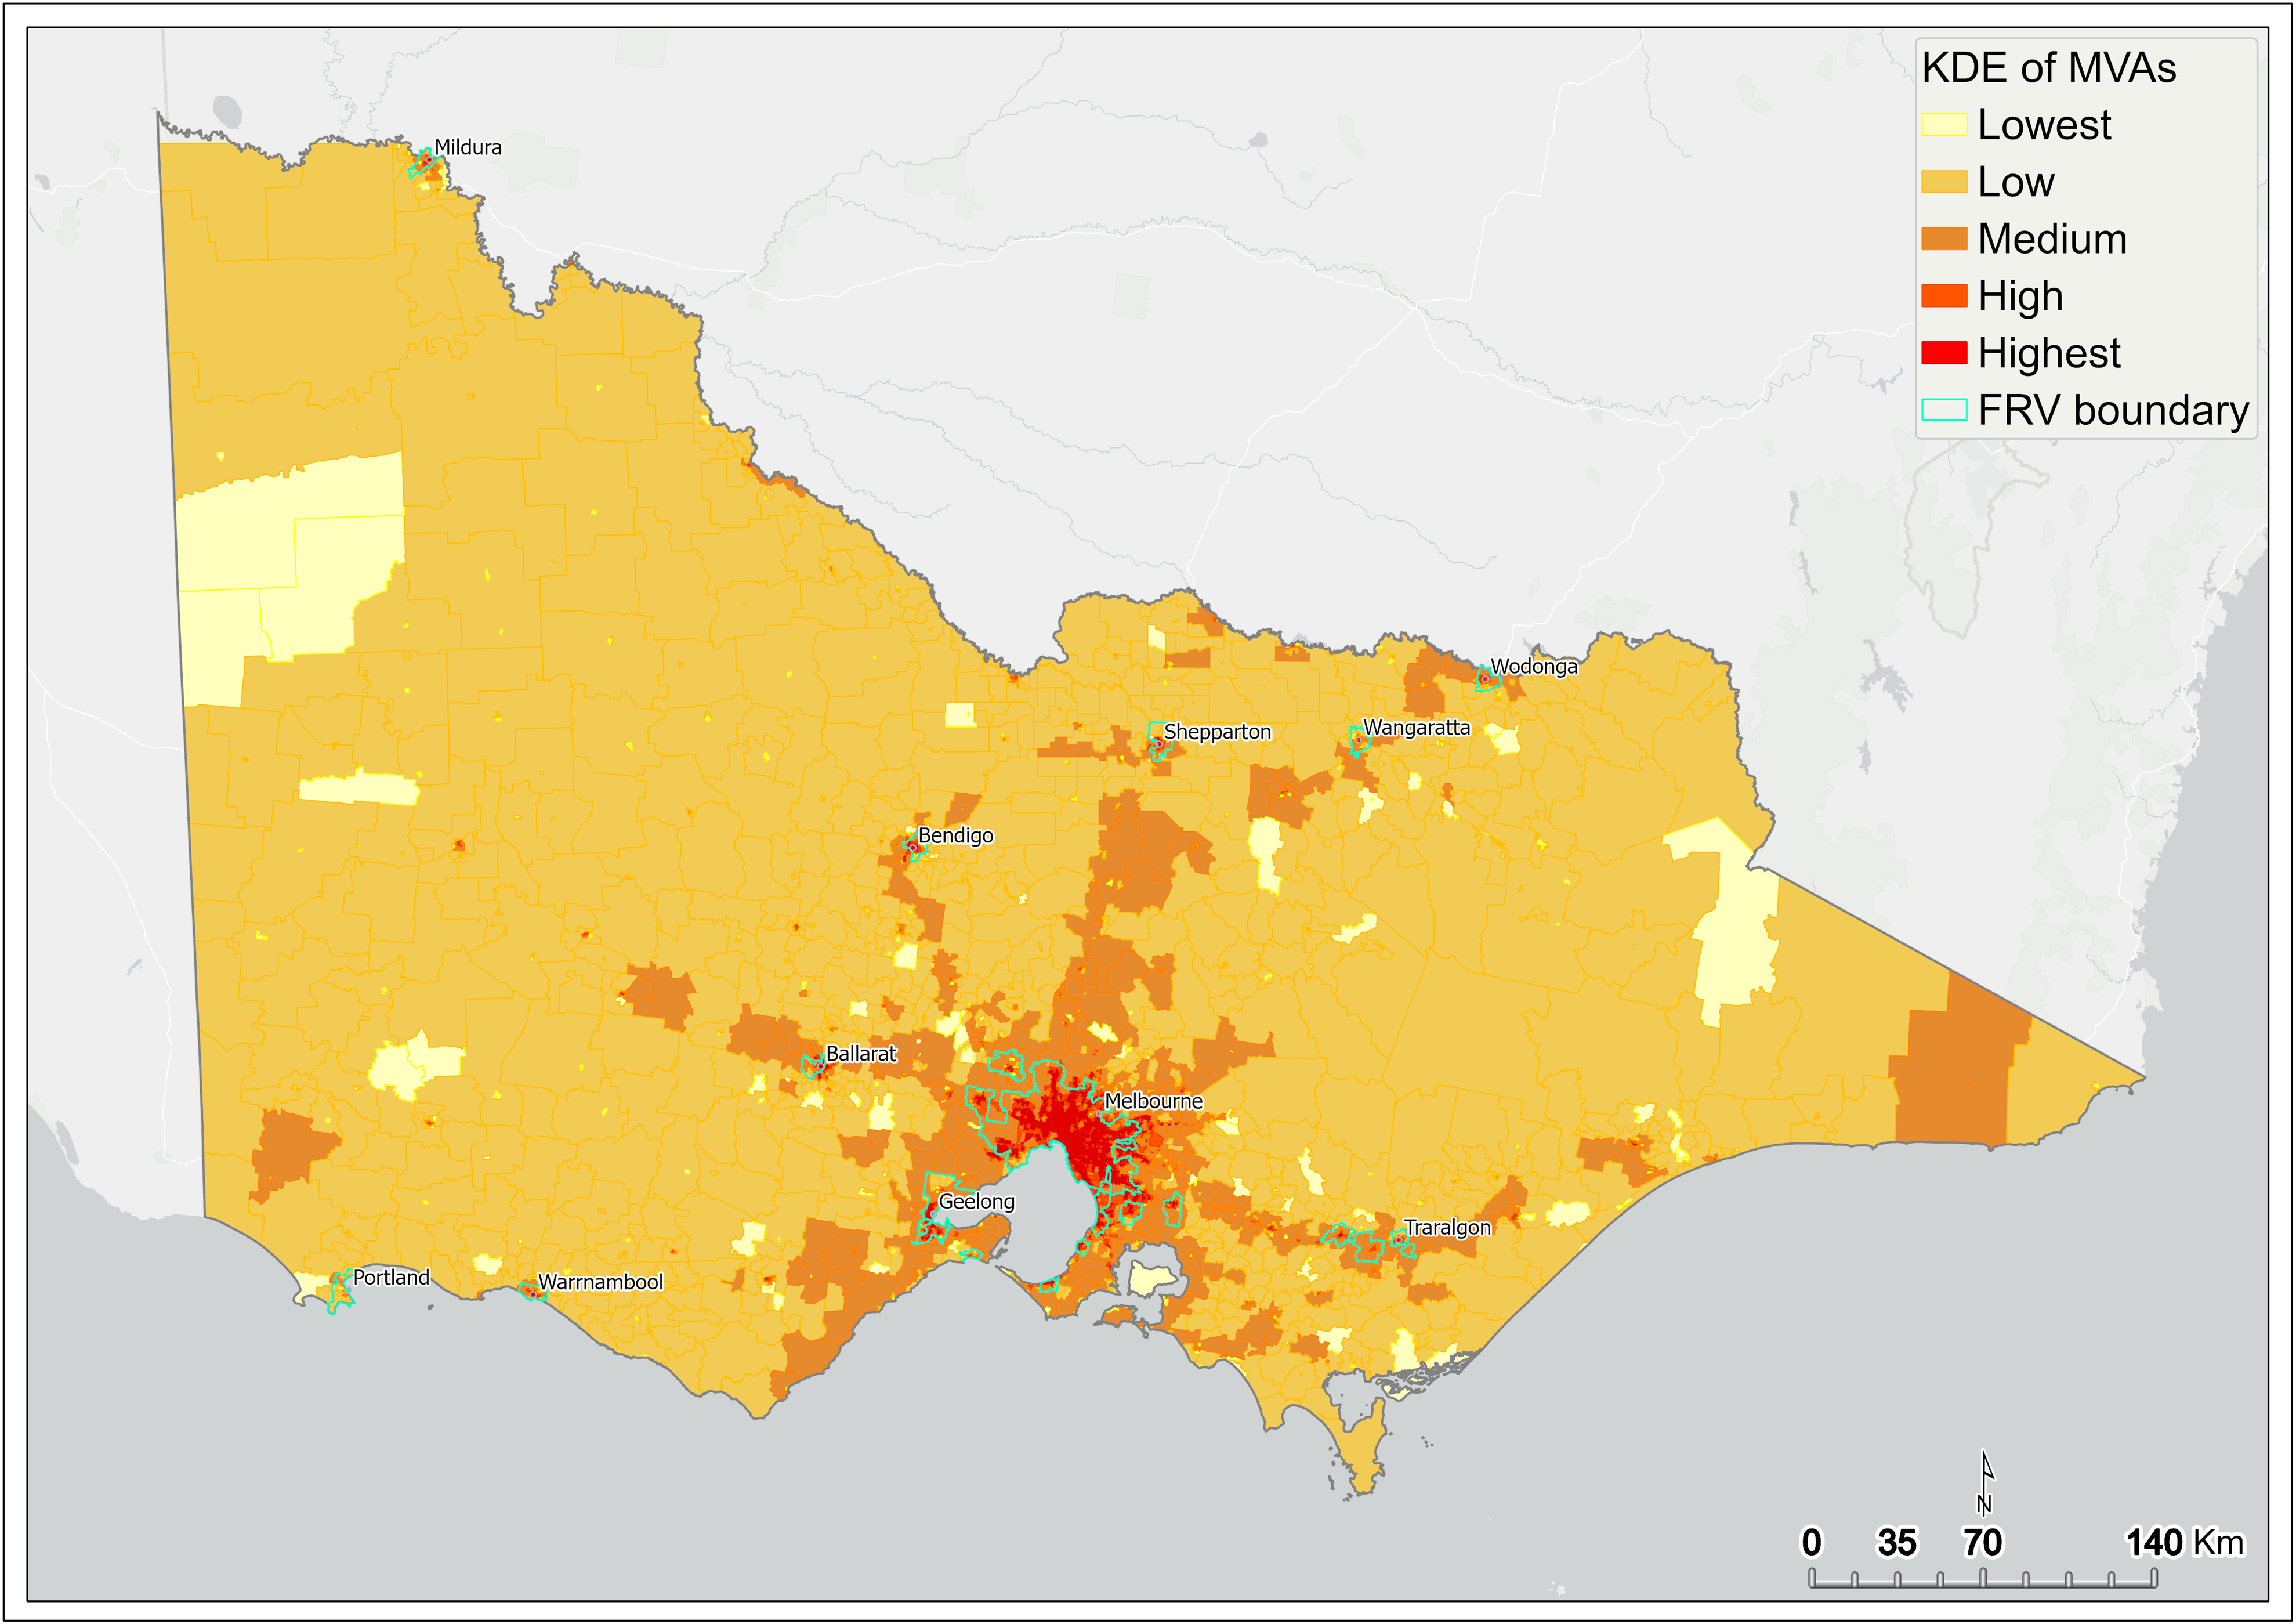
Figure 11 Kernel density estimation of motor vehicle accidents by SA1 – metropolitan Melbourne
2.4.5 Cluster analysis of fire casualties
Cluster analysis is used to map the count of fire casualties (fatality and injury) across Victoria. Incidents resulting in casualties from 2010 to 2019 are mapped with graduated symbols showing a score from one to greater than five casualties per SA1. Figure 12 shows a map of the count of casualties resulting from fire incidents across SA1s of Victoria. The output from this analysis was subsequently input to the initial DSA.
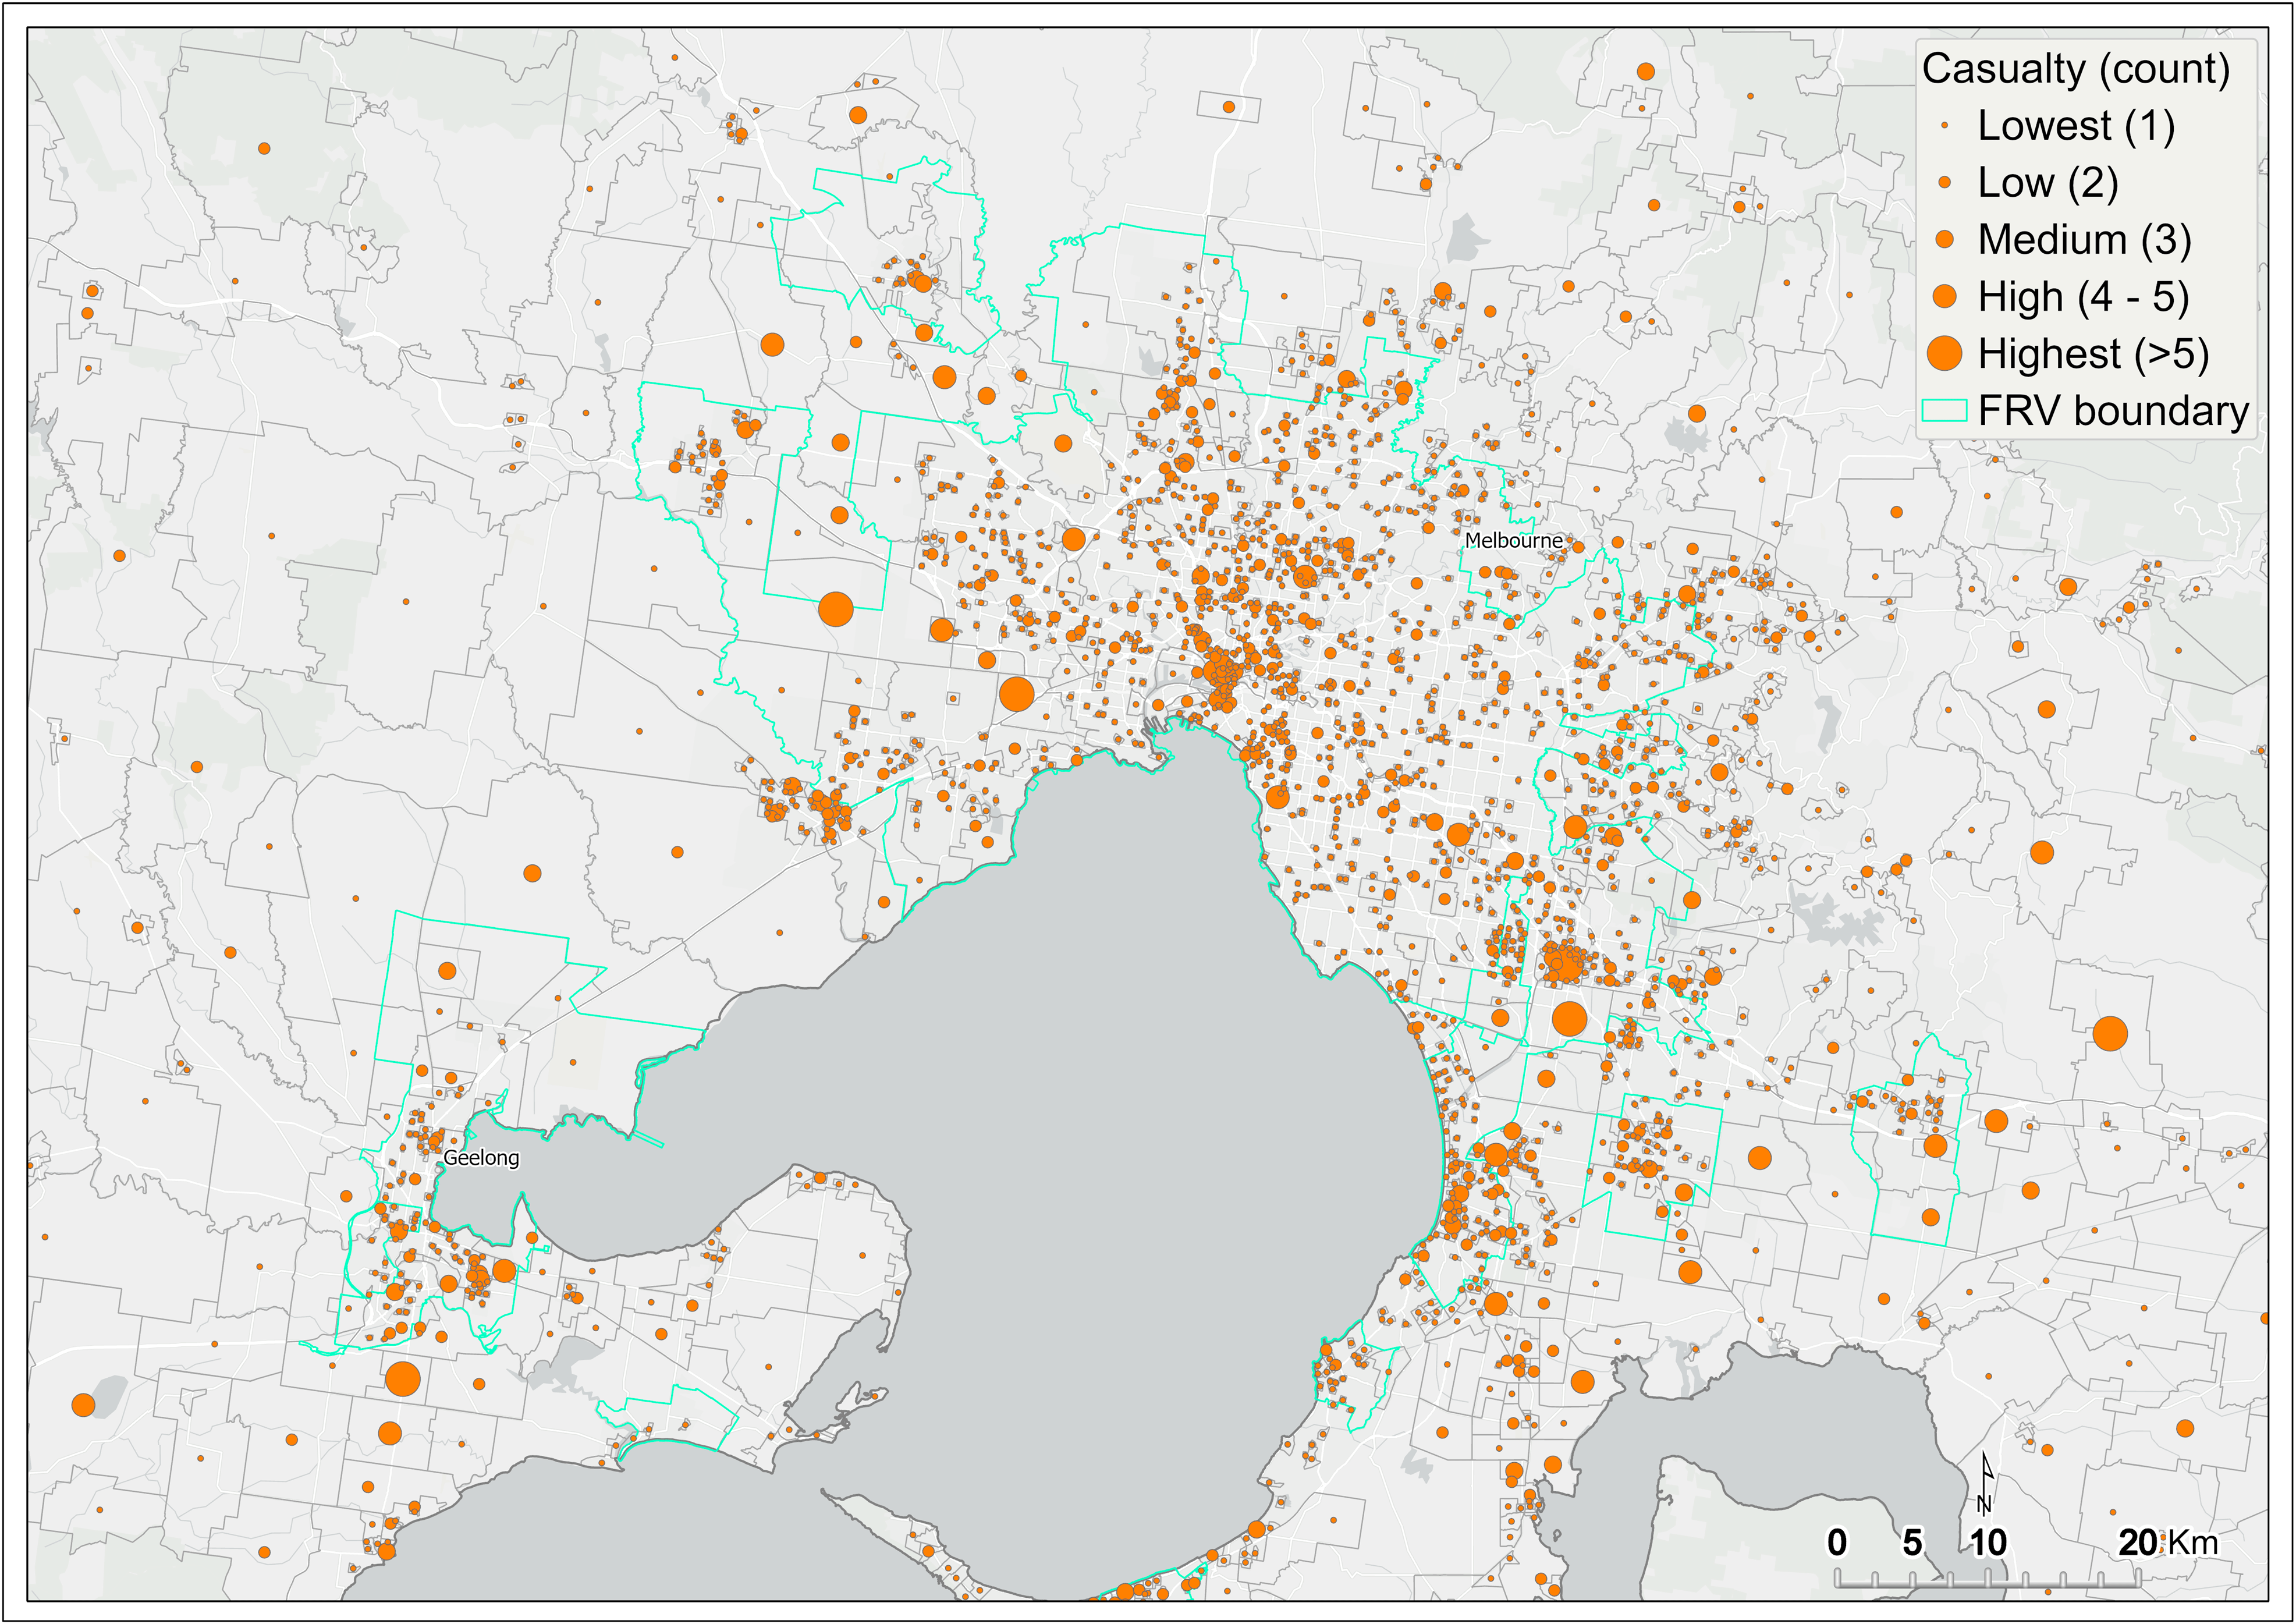
The greatest count of fire-related casualties is concentrated within metropolitan Melbourne (Figure 13). In the regions, fire-related casualty is high in central and northern parts of the Victoria. However, isolated regional centres in eastern and western Victoria demonstrate similarly high fire casualty count (Figure 12).
Figure 12 Casualty (fatality and injury) by SA1 – statewide
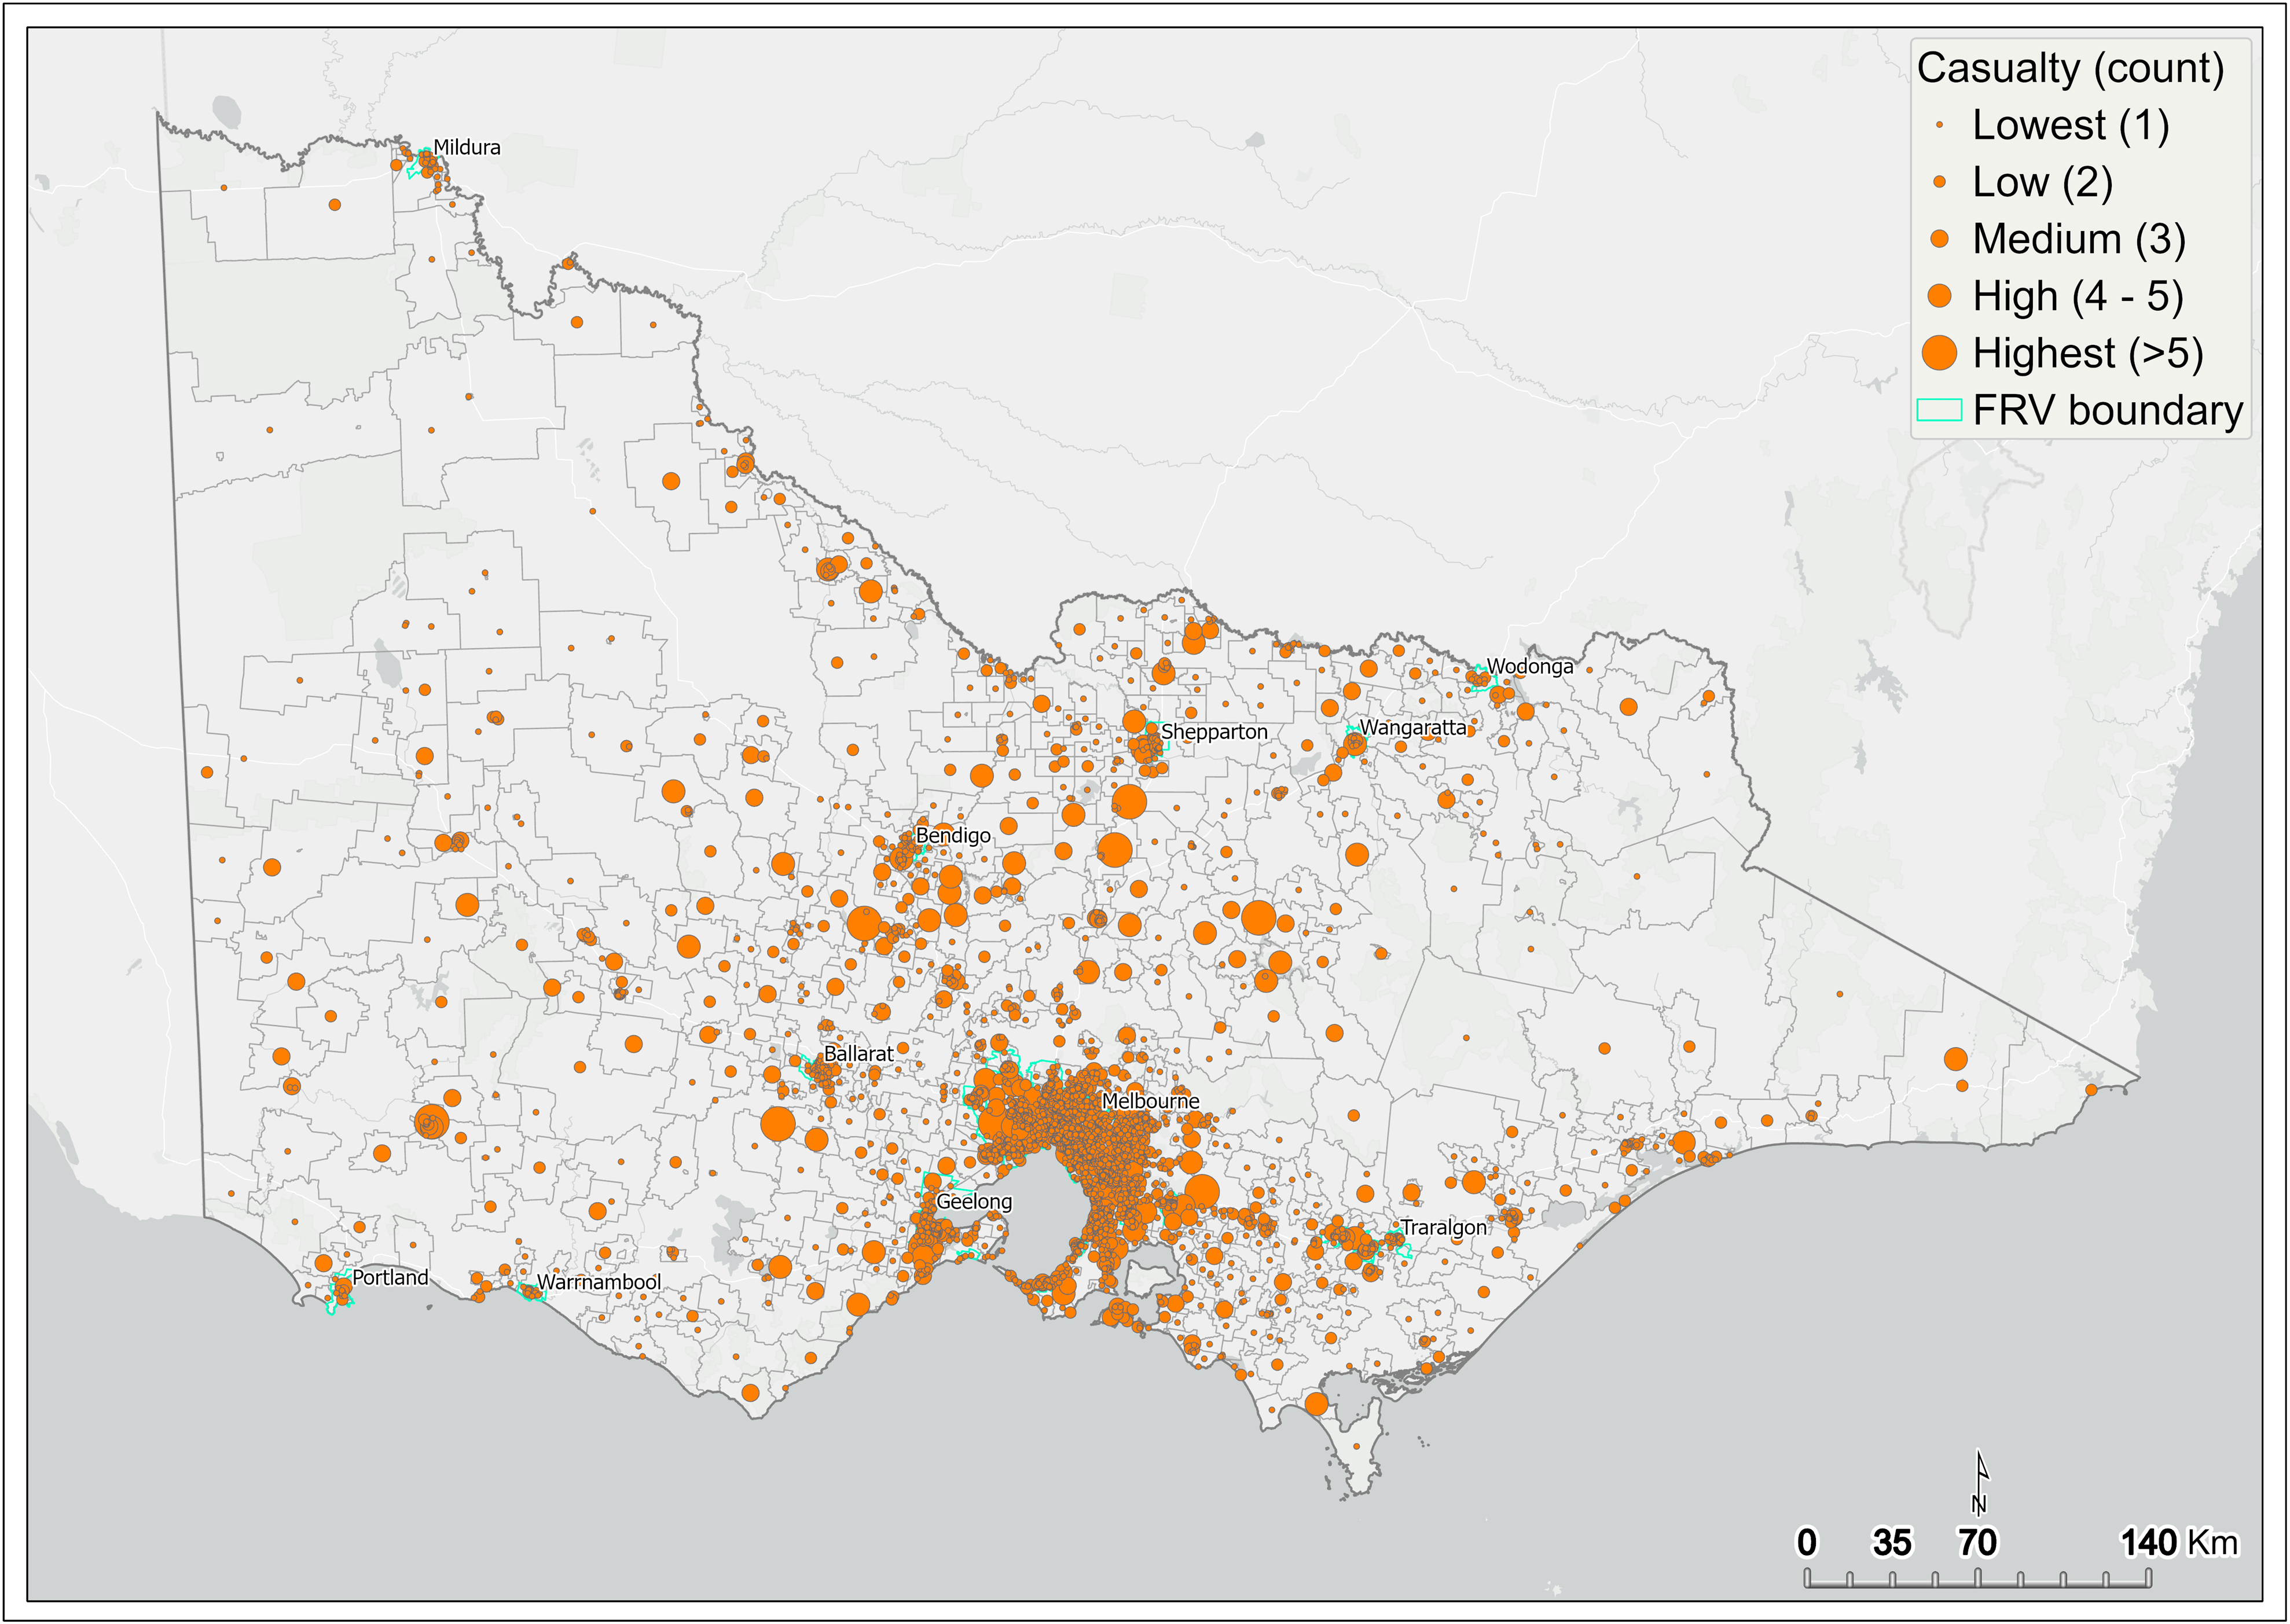
Figure 13 Casualty (fatality and injury) by SA1 – metropolitan Melbourne
2.4.6 Service Delivery Standard failure mapping
SDS4 (response time) failure is examined by mapping the count of fire incidents that failed to meet the SDS. The total count of incidents that failed to meet the SDS is categorised into five groups:
Lowest (≤10), Low (11 to 25), Medium (26 to 50), High (51 to 100) and Highest (>100).
Figure 14 shows a spatial pattern of the count of fire incidents that failed to meet the SDS statewide, and Figure 15 shows the same for metropolitan Melbourne. SA1s containing the lowest number of such incidents (that is, one to 10) not meeting the SDS are shown in yellow. These SA1s are located across much of regional Victoria and most parts of metropolitan Melbourne. SA1s containing zero incidents failing the SDS are not mapped.
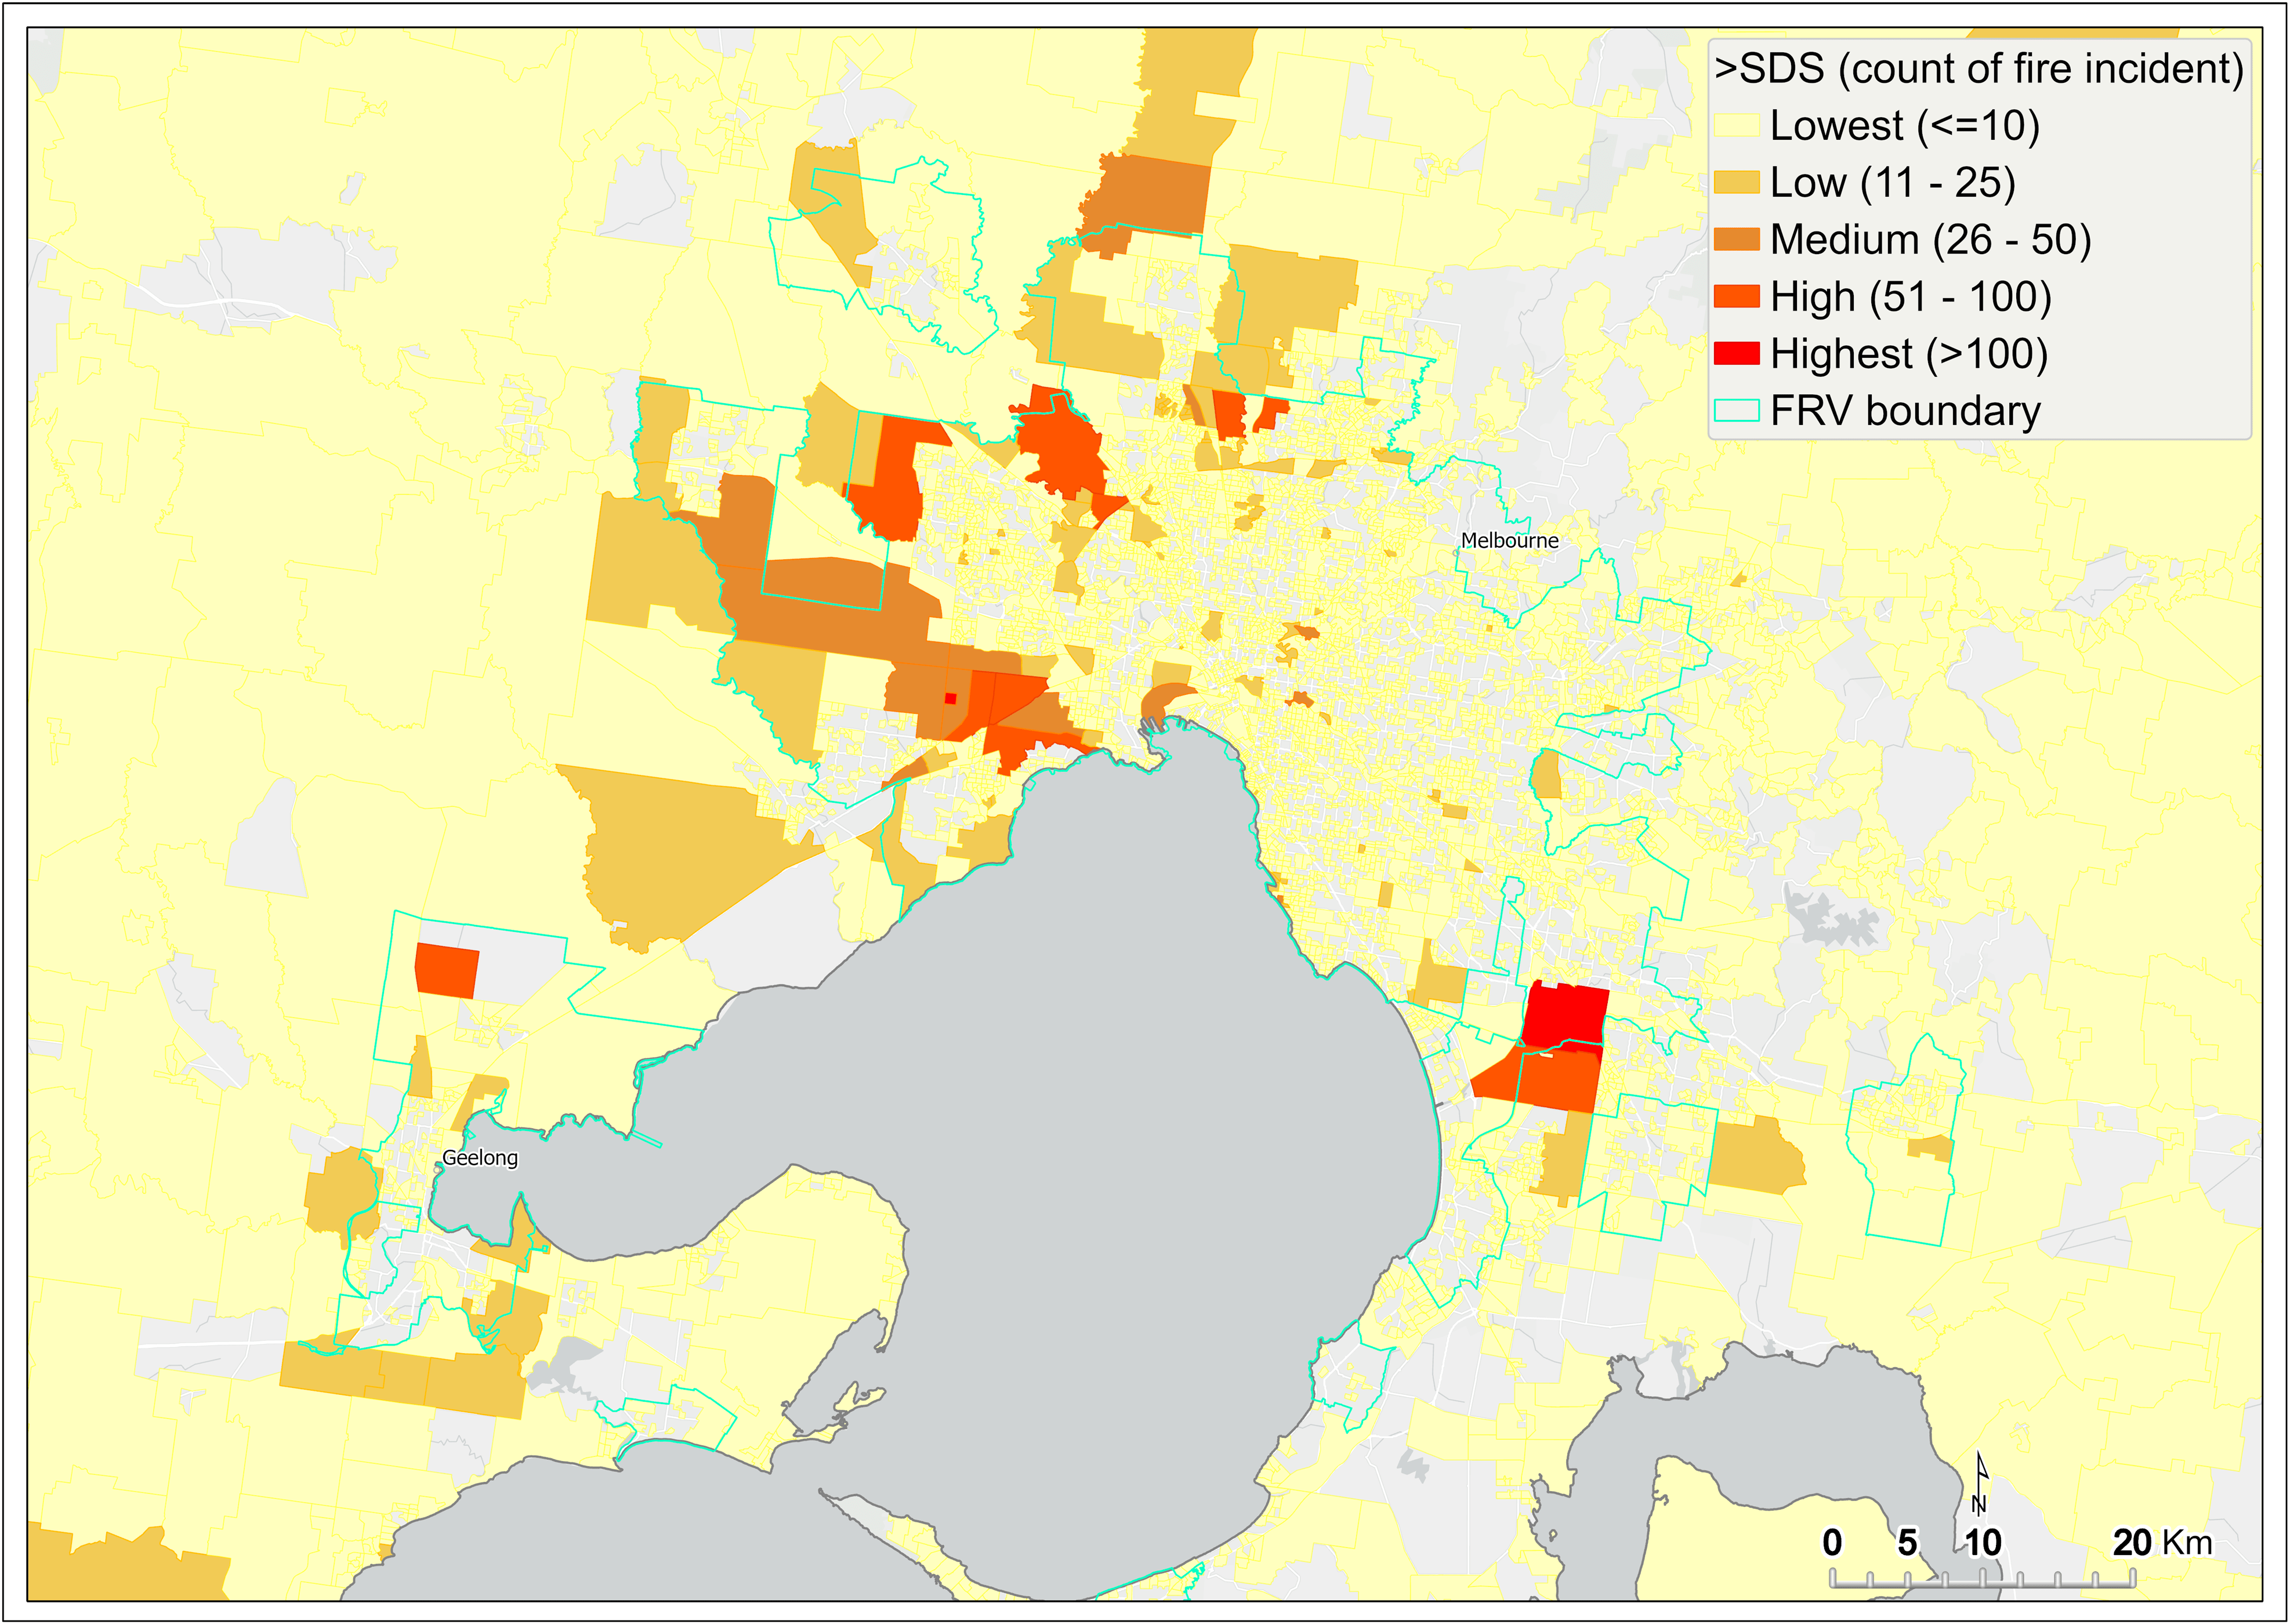
SDS failures have the potential to increase injury and fatality, so SA1s containing a high number of incidents not meeting the SDS are of major concern. The SA1s in the two highest categories (51 to 100 incidents and more than 100 incidents) are mainly located on the western metro fringe, straddling the FRV south-east boundary and in Gippsland. SA1s with greater than 100 incidents that were not responded to within SDS (highest category) are shown in red.
Figure 14 Count of fire incidents that failed to meet SDS – statewide
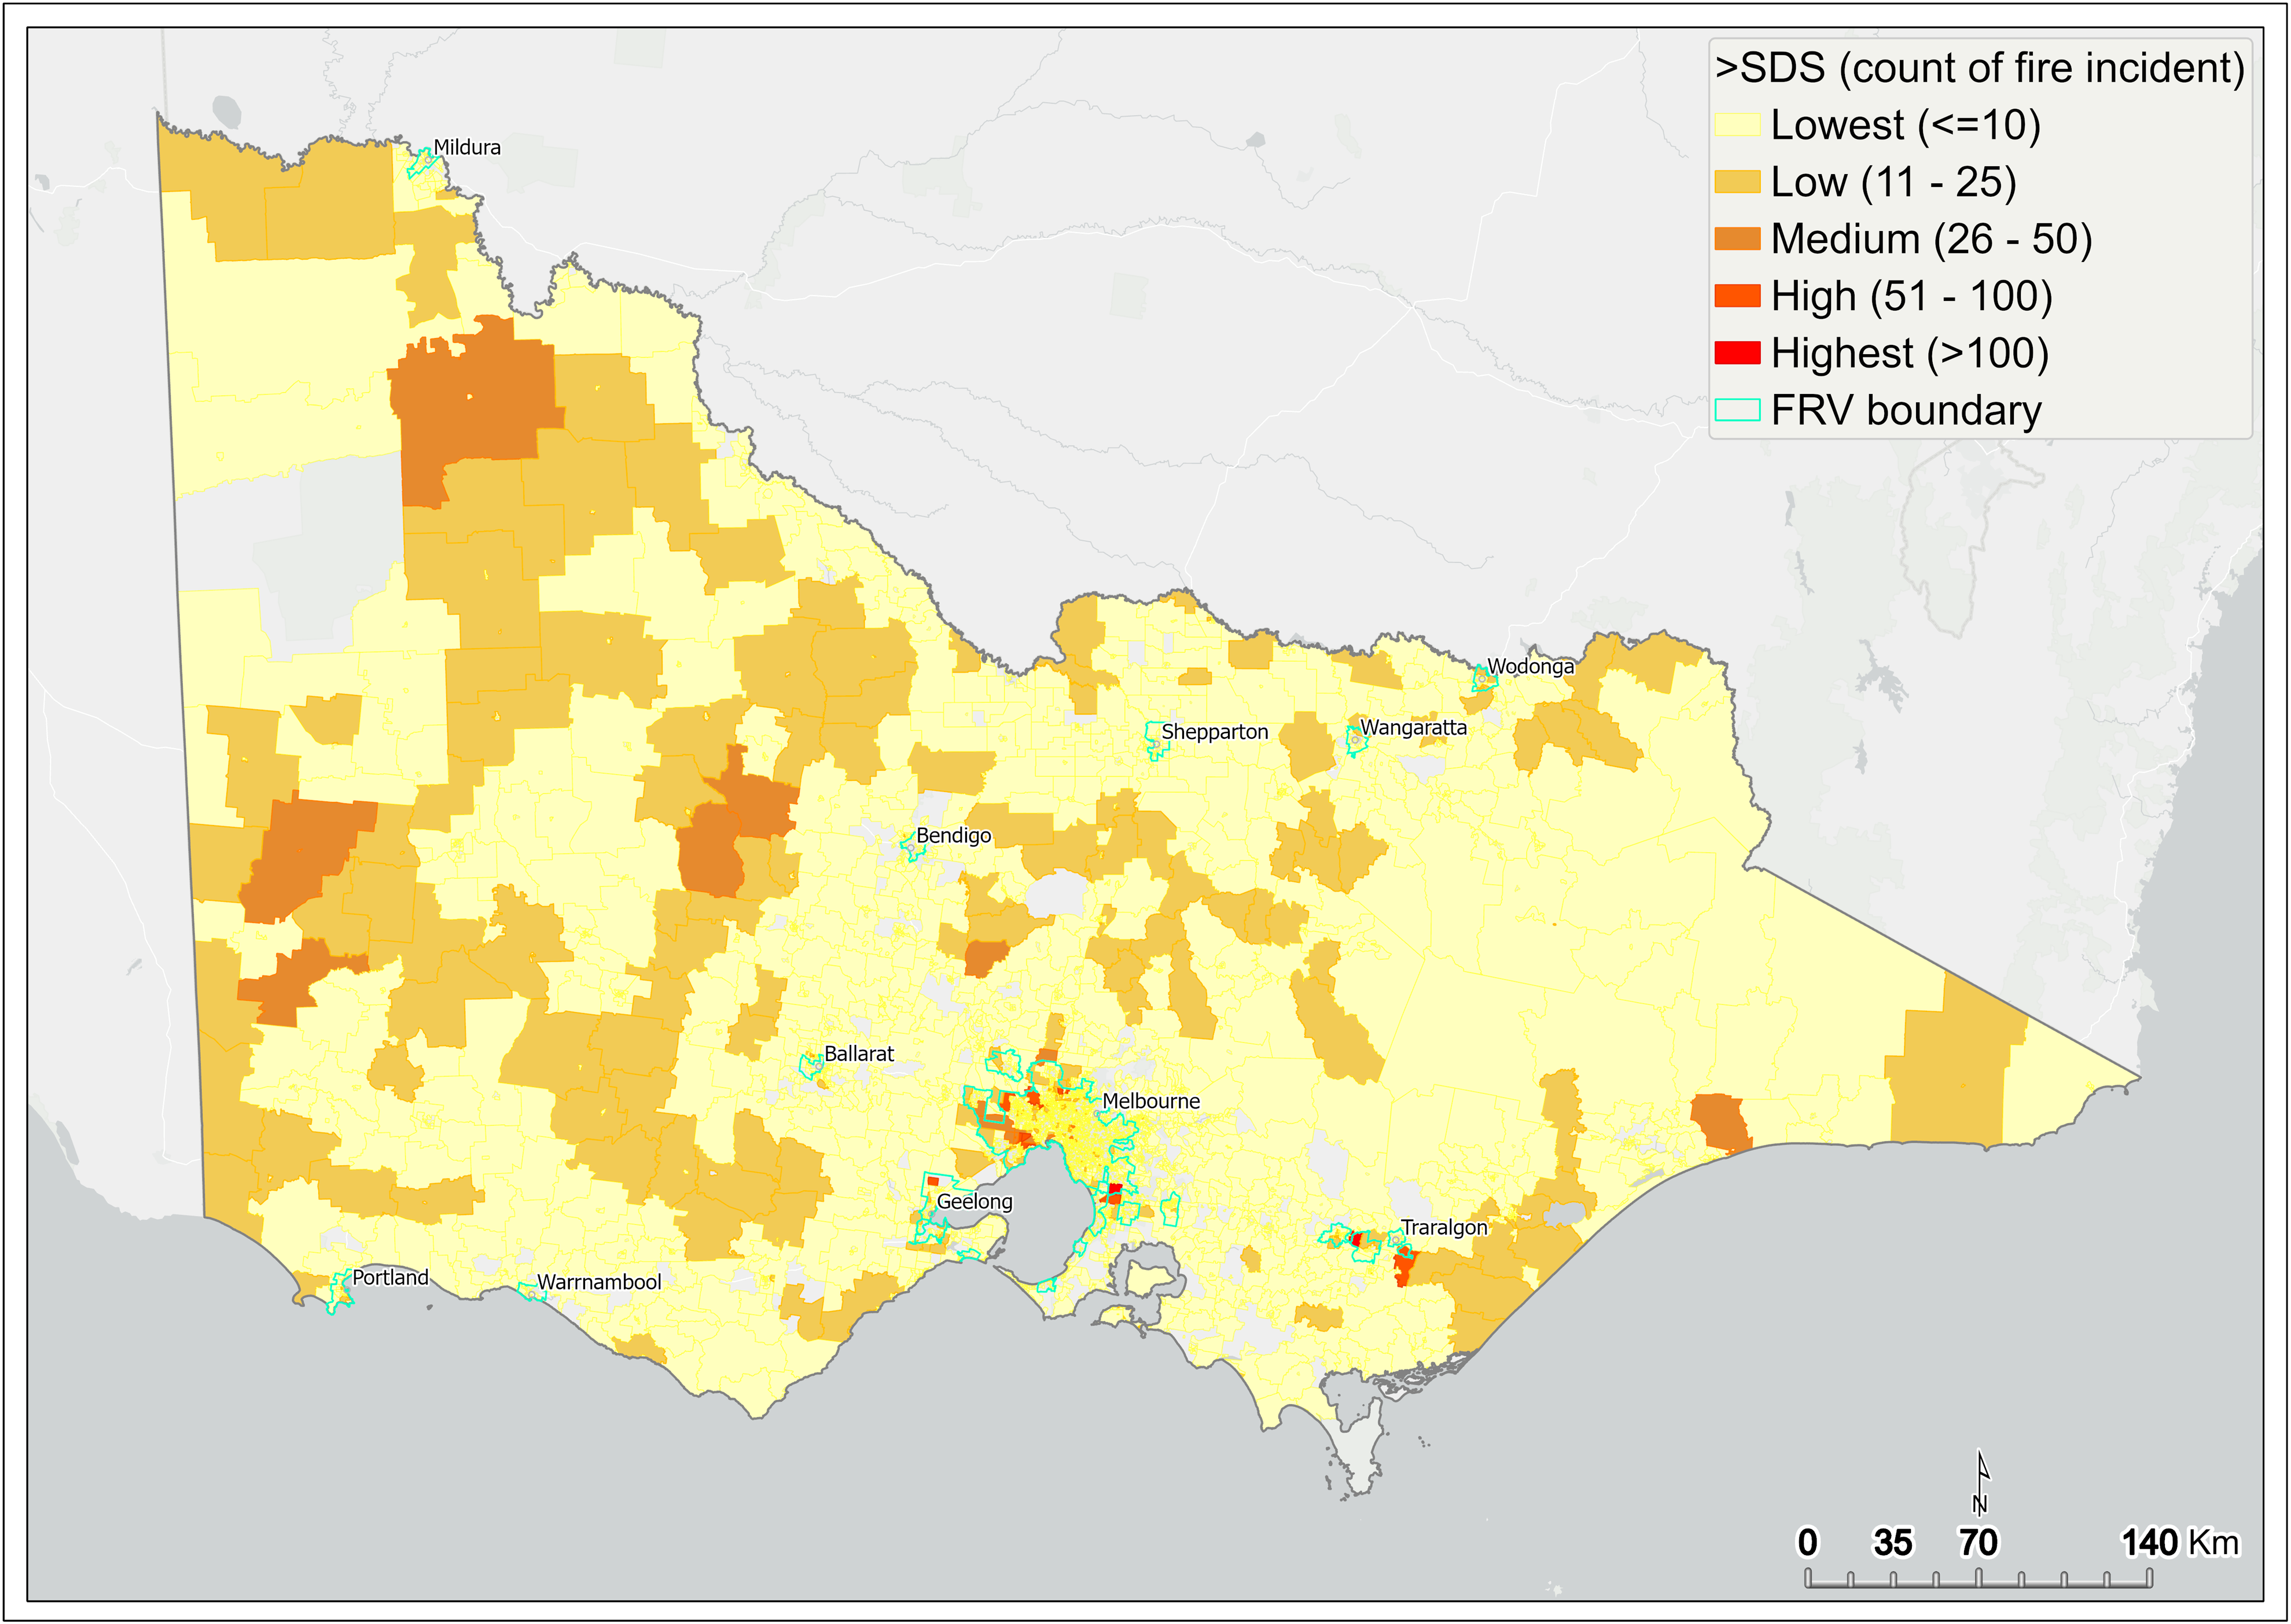
Figure 15 Count of fire incidents that failed to meet SDS – metropolitan Melbourne
2.5 Fire risk estimation
Fire risk is estimated using two-step Markov chain5 modelling. The Markov chain estimation (MCE) routine is run across a statewide grid. The grid cells facilitate the transition from one scenario to another. A single transition is referred to as a step. Our analysis is two-step, which investigates the transition from no fire to fire (P01).
P01 =
the probability of fire in grid at t given no fire within neighbourhood at t-1
The results from this modelling are subsequently aggregated to the SA1 scale. The estimated probability of having at least one fire at time (t) given there was no fire in within the neighbourhood in past (t-1) is categorised into five groups:
Lowest (≤10%), Low (>10% to ≤25%), Medium (>25% to ≤50%), High (>50% to ≤75%) and Highest (>75%).
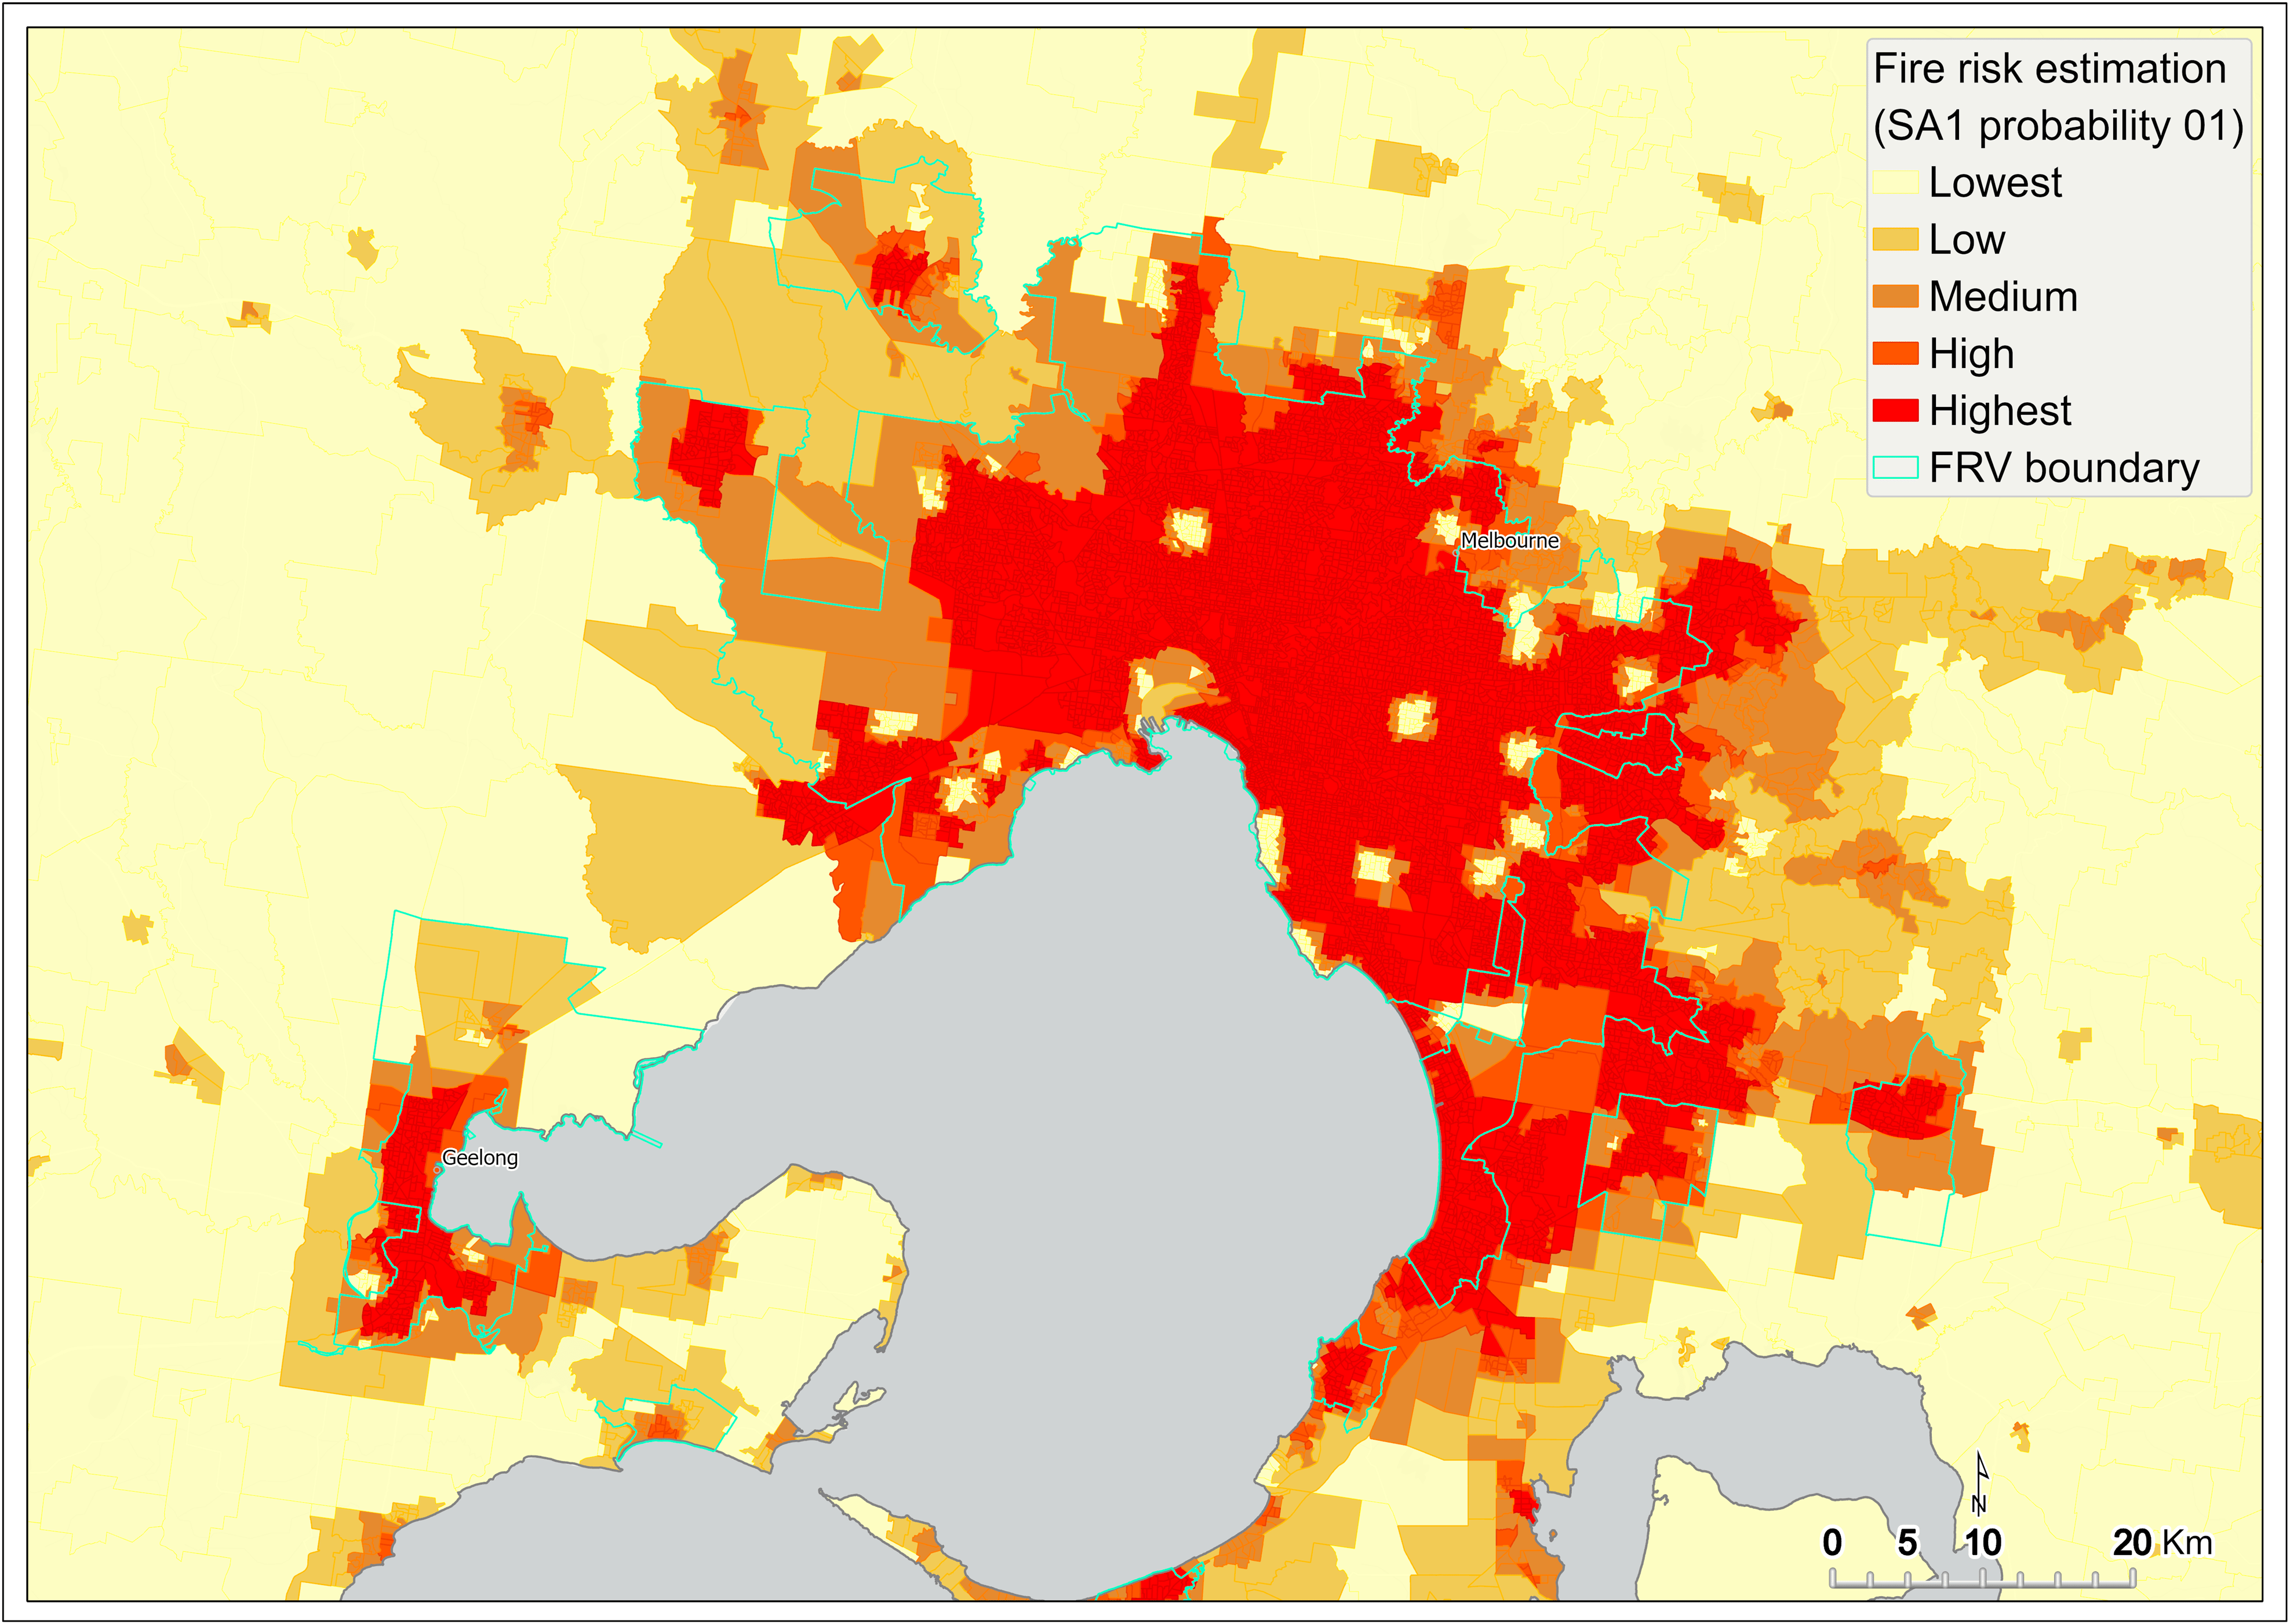
The areas of the state having greater than 50 per cent of probability of fire risk are predominantly concentrated within metropolitan Melbourne (Figure 17), as well as some regional centres such as greater Ballarat, Bendigo, Shepparton, Wodonga and around Traralgon (Figure 16).
Figure 16 Fire risk estimation (P01) – statewide
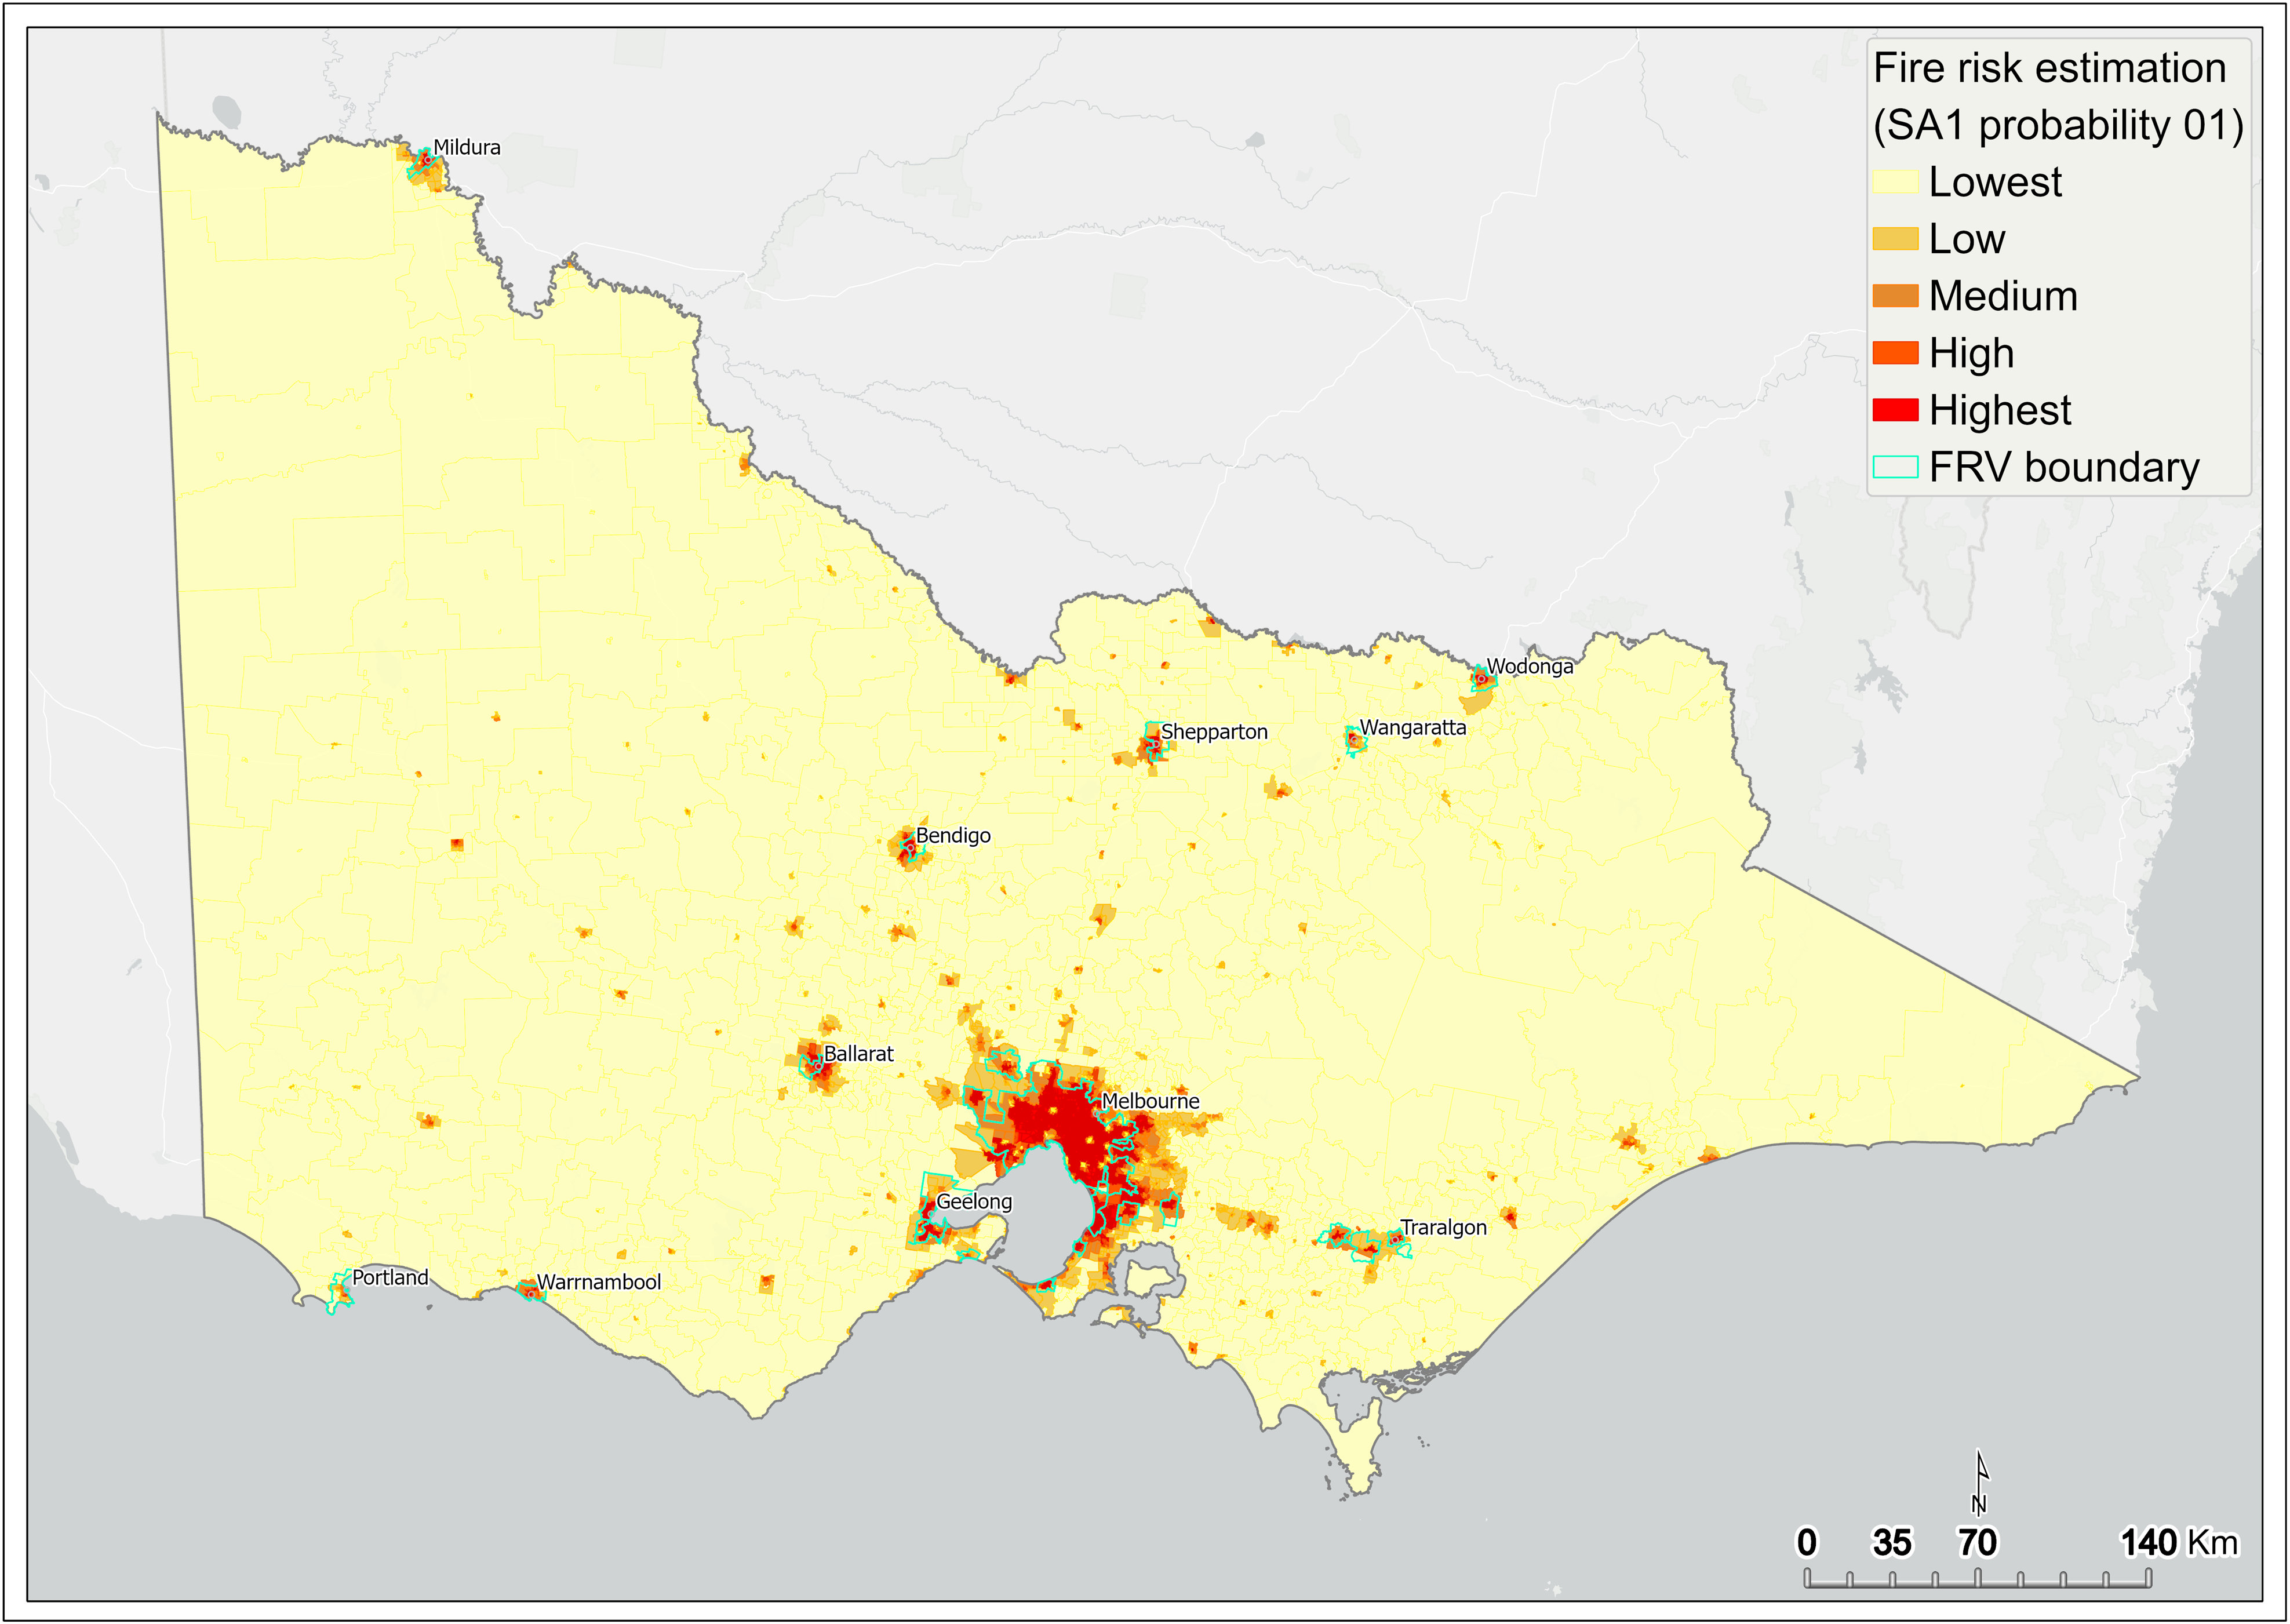
Figure 17 Fire risk estimation (P01) – metropolitan Melbourne
Footnotes
[2] Involving two variables
[3] Statistical significance helps quantify whether a result is likely due to chance or to some factor of interest.
[4] Incidents coded as ‘excluded from SDS’ were not included in this analysis.
[5] https://towardsdatascience.com/introduction-to-markov-chains-50da3645a50d
3. Initial decision support analysis
The DSA is an ‘out of the box’ tool, available in the ArcGIS Business Analyst extension, commercially known as Suitability Analyst. The tool transforms and combines geographical data and evaluation criteria to solve spatial problems. The evaluation criteria are determined by expert opinion and knowledge of the datasets.
The initial DSA accommodates multiple spatial inputs and supports the development of a single risk map.
The outputs outlined in Sections 2.4 and 2.5, produced at the SA1 scale, are input to the tool. The initial DSA workflow is computed in four steps:
- Make the initial DSA base layer (SA1 boundaries).
- Add field-based criteria (Sections 2.4 and 2.5).
- Set criteria properties (see Appendix B).
- Calculate initial DSA fire risk score (see Appendix B, Equation 1, Equation 2).
The initial DSA score represents the fire risk score, which is subsequently mapped across the SA1 areas of Victoria (Figure 18).
3.1 Thresholds and influence
The levels of fire risk are defined according to the minimum and maximum thresholds and influence of each criterion (Table A1). This guides the identification in the initial DSA of SA1s that are consistently represented by high values. Thresholds are determined by interpreting statistical data for each criterion. For further information on this process, see Appendix B.
3.2 Statewide fire risk
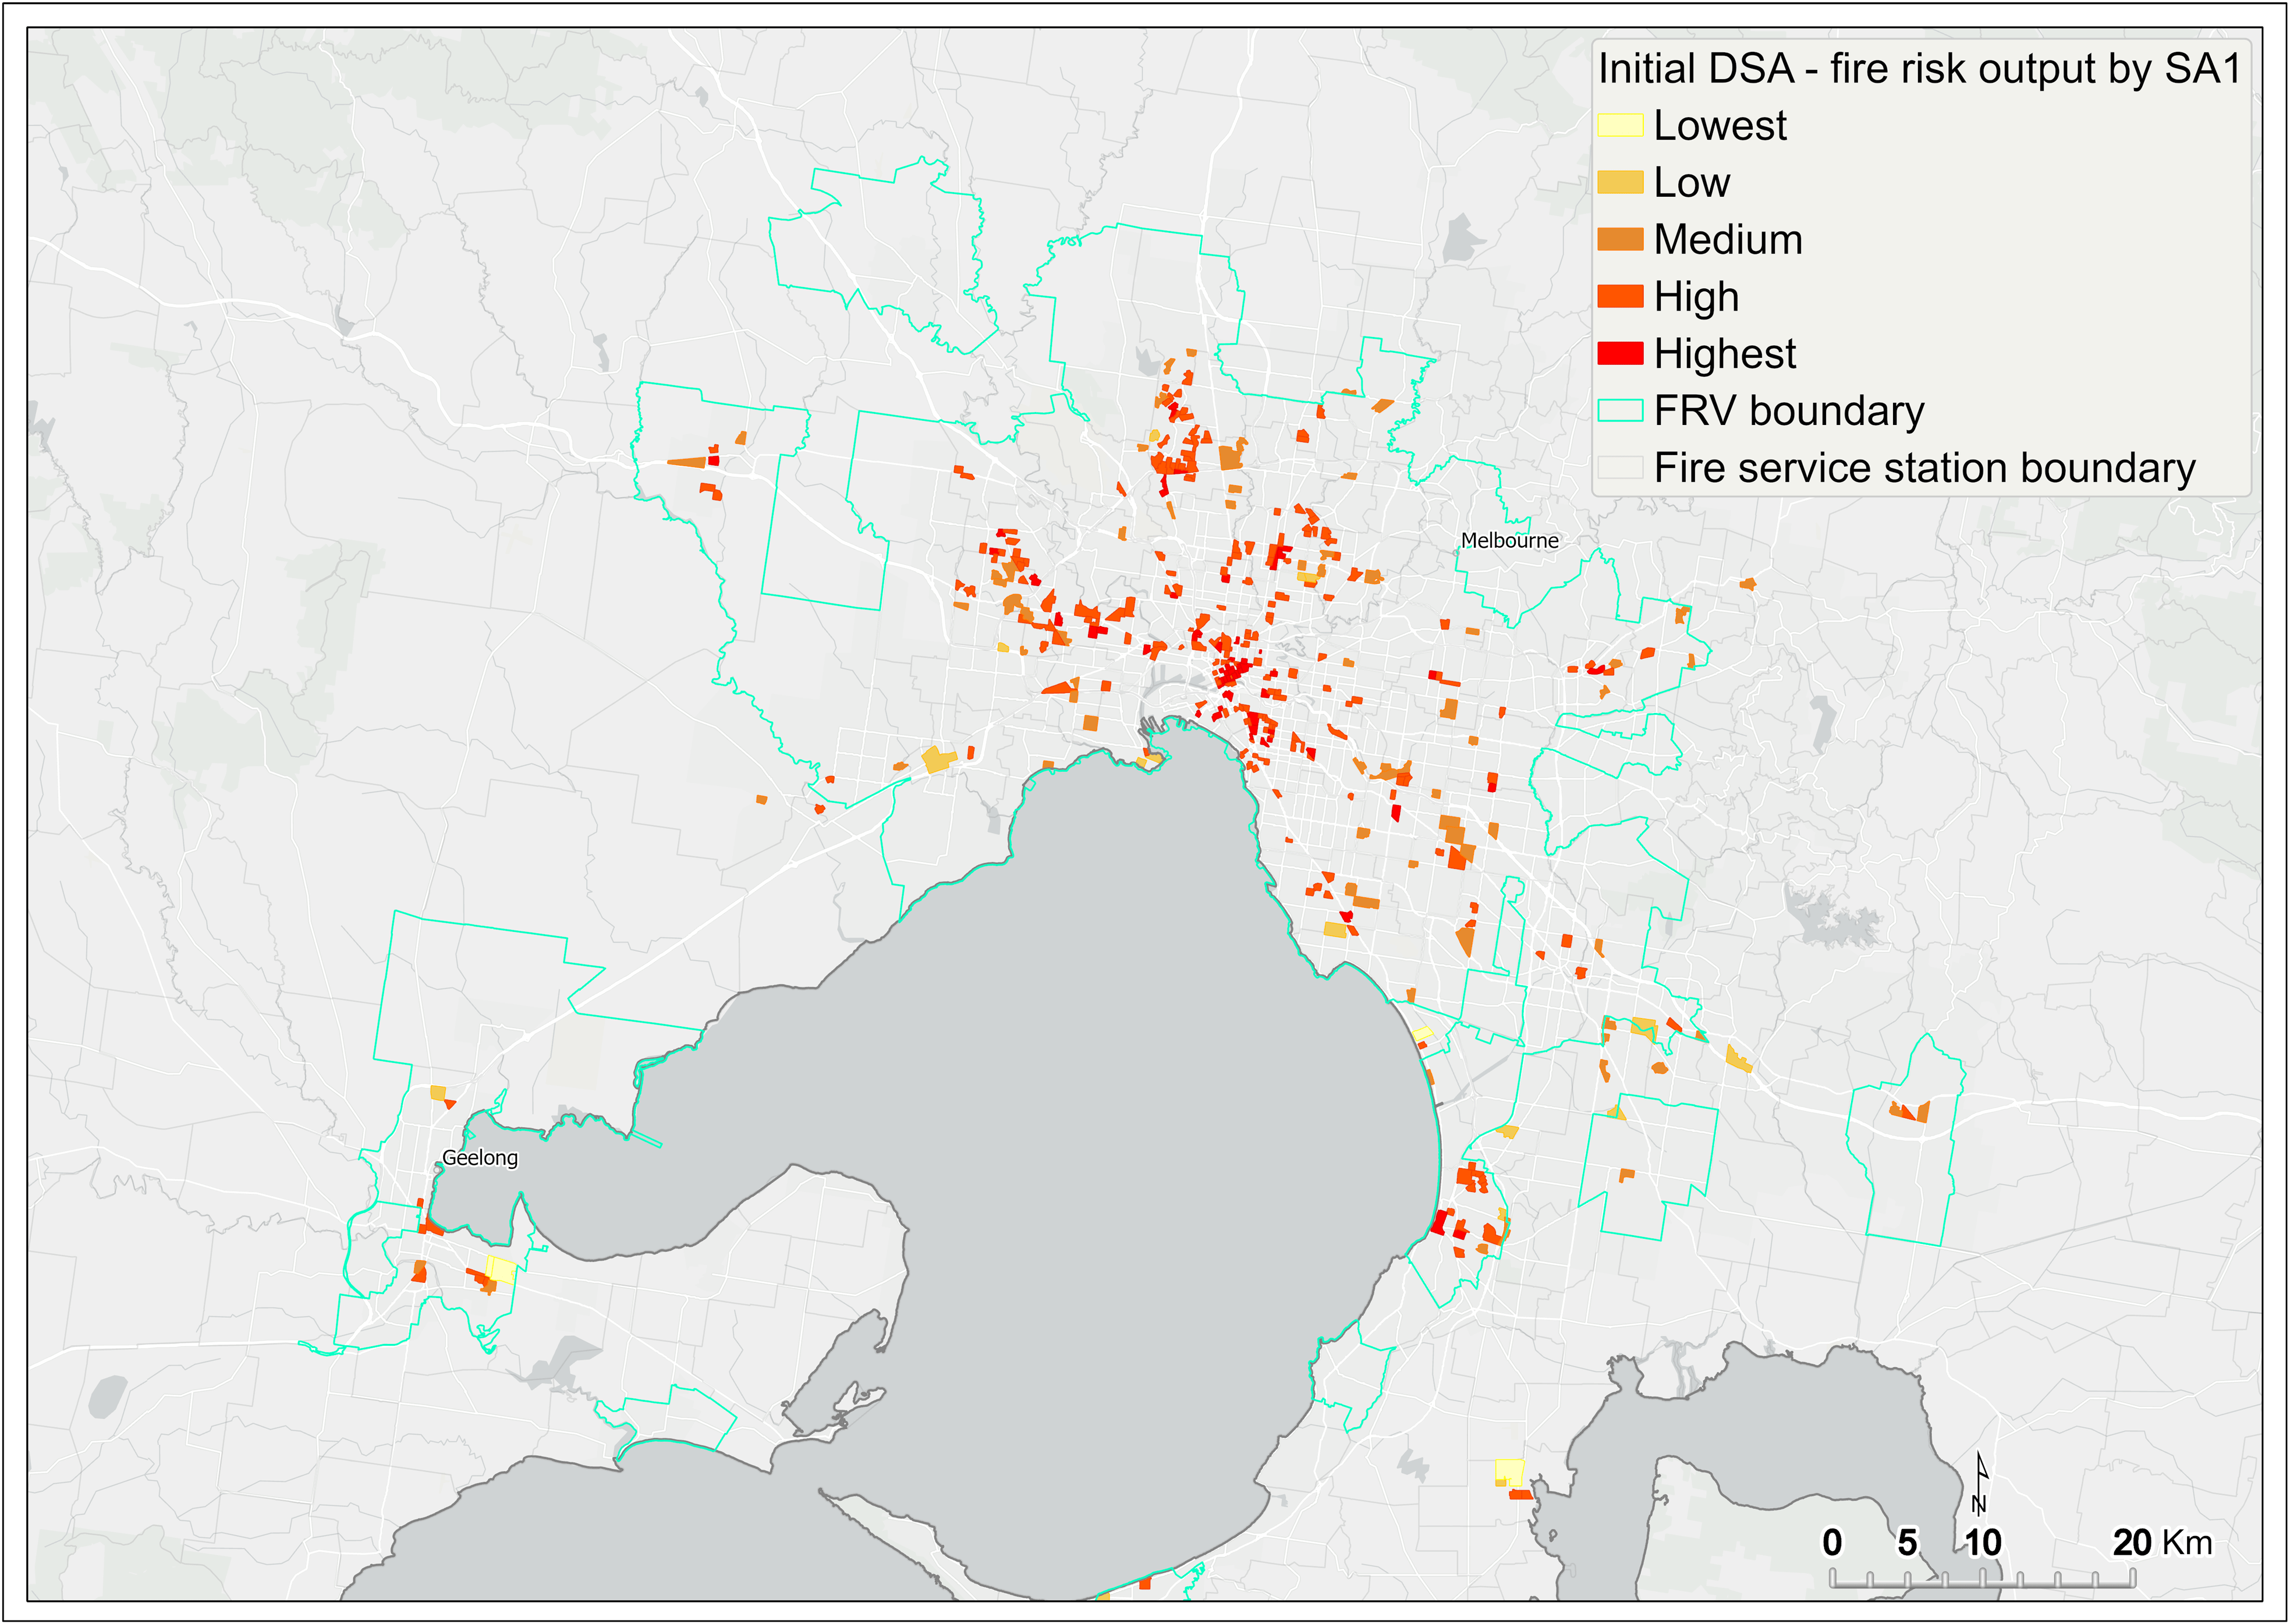
The output from the application of the initial DSA ranks the SA1s according to a risk score, displayed as colour coded symbols in map format (Figure 18).
Risk scores are classified according to an equal interval,6 where the fire risk is subsequently mapped in five categories: Lowest, Low, Medium, High, Highest.
The spatial distribution of fire risk is shown across the state in Figure 18 and in the Melbourne metropolitan area in Figure 19.
The figures show that the most common fire risk category is High, and mapped SA1s occur in greatest numbers in the CBD and many inner and outer suburbs of Melbourne. This dominant risk category is also present in the larger regional centres, such as Ballarat, Bendigo, Geelong, Mildura, Wodonga, and Shepparton.
Figure 18 Initial DSA fire risk output by SA1 – statewide
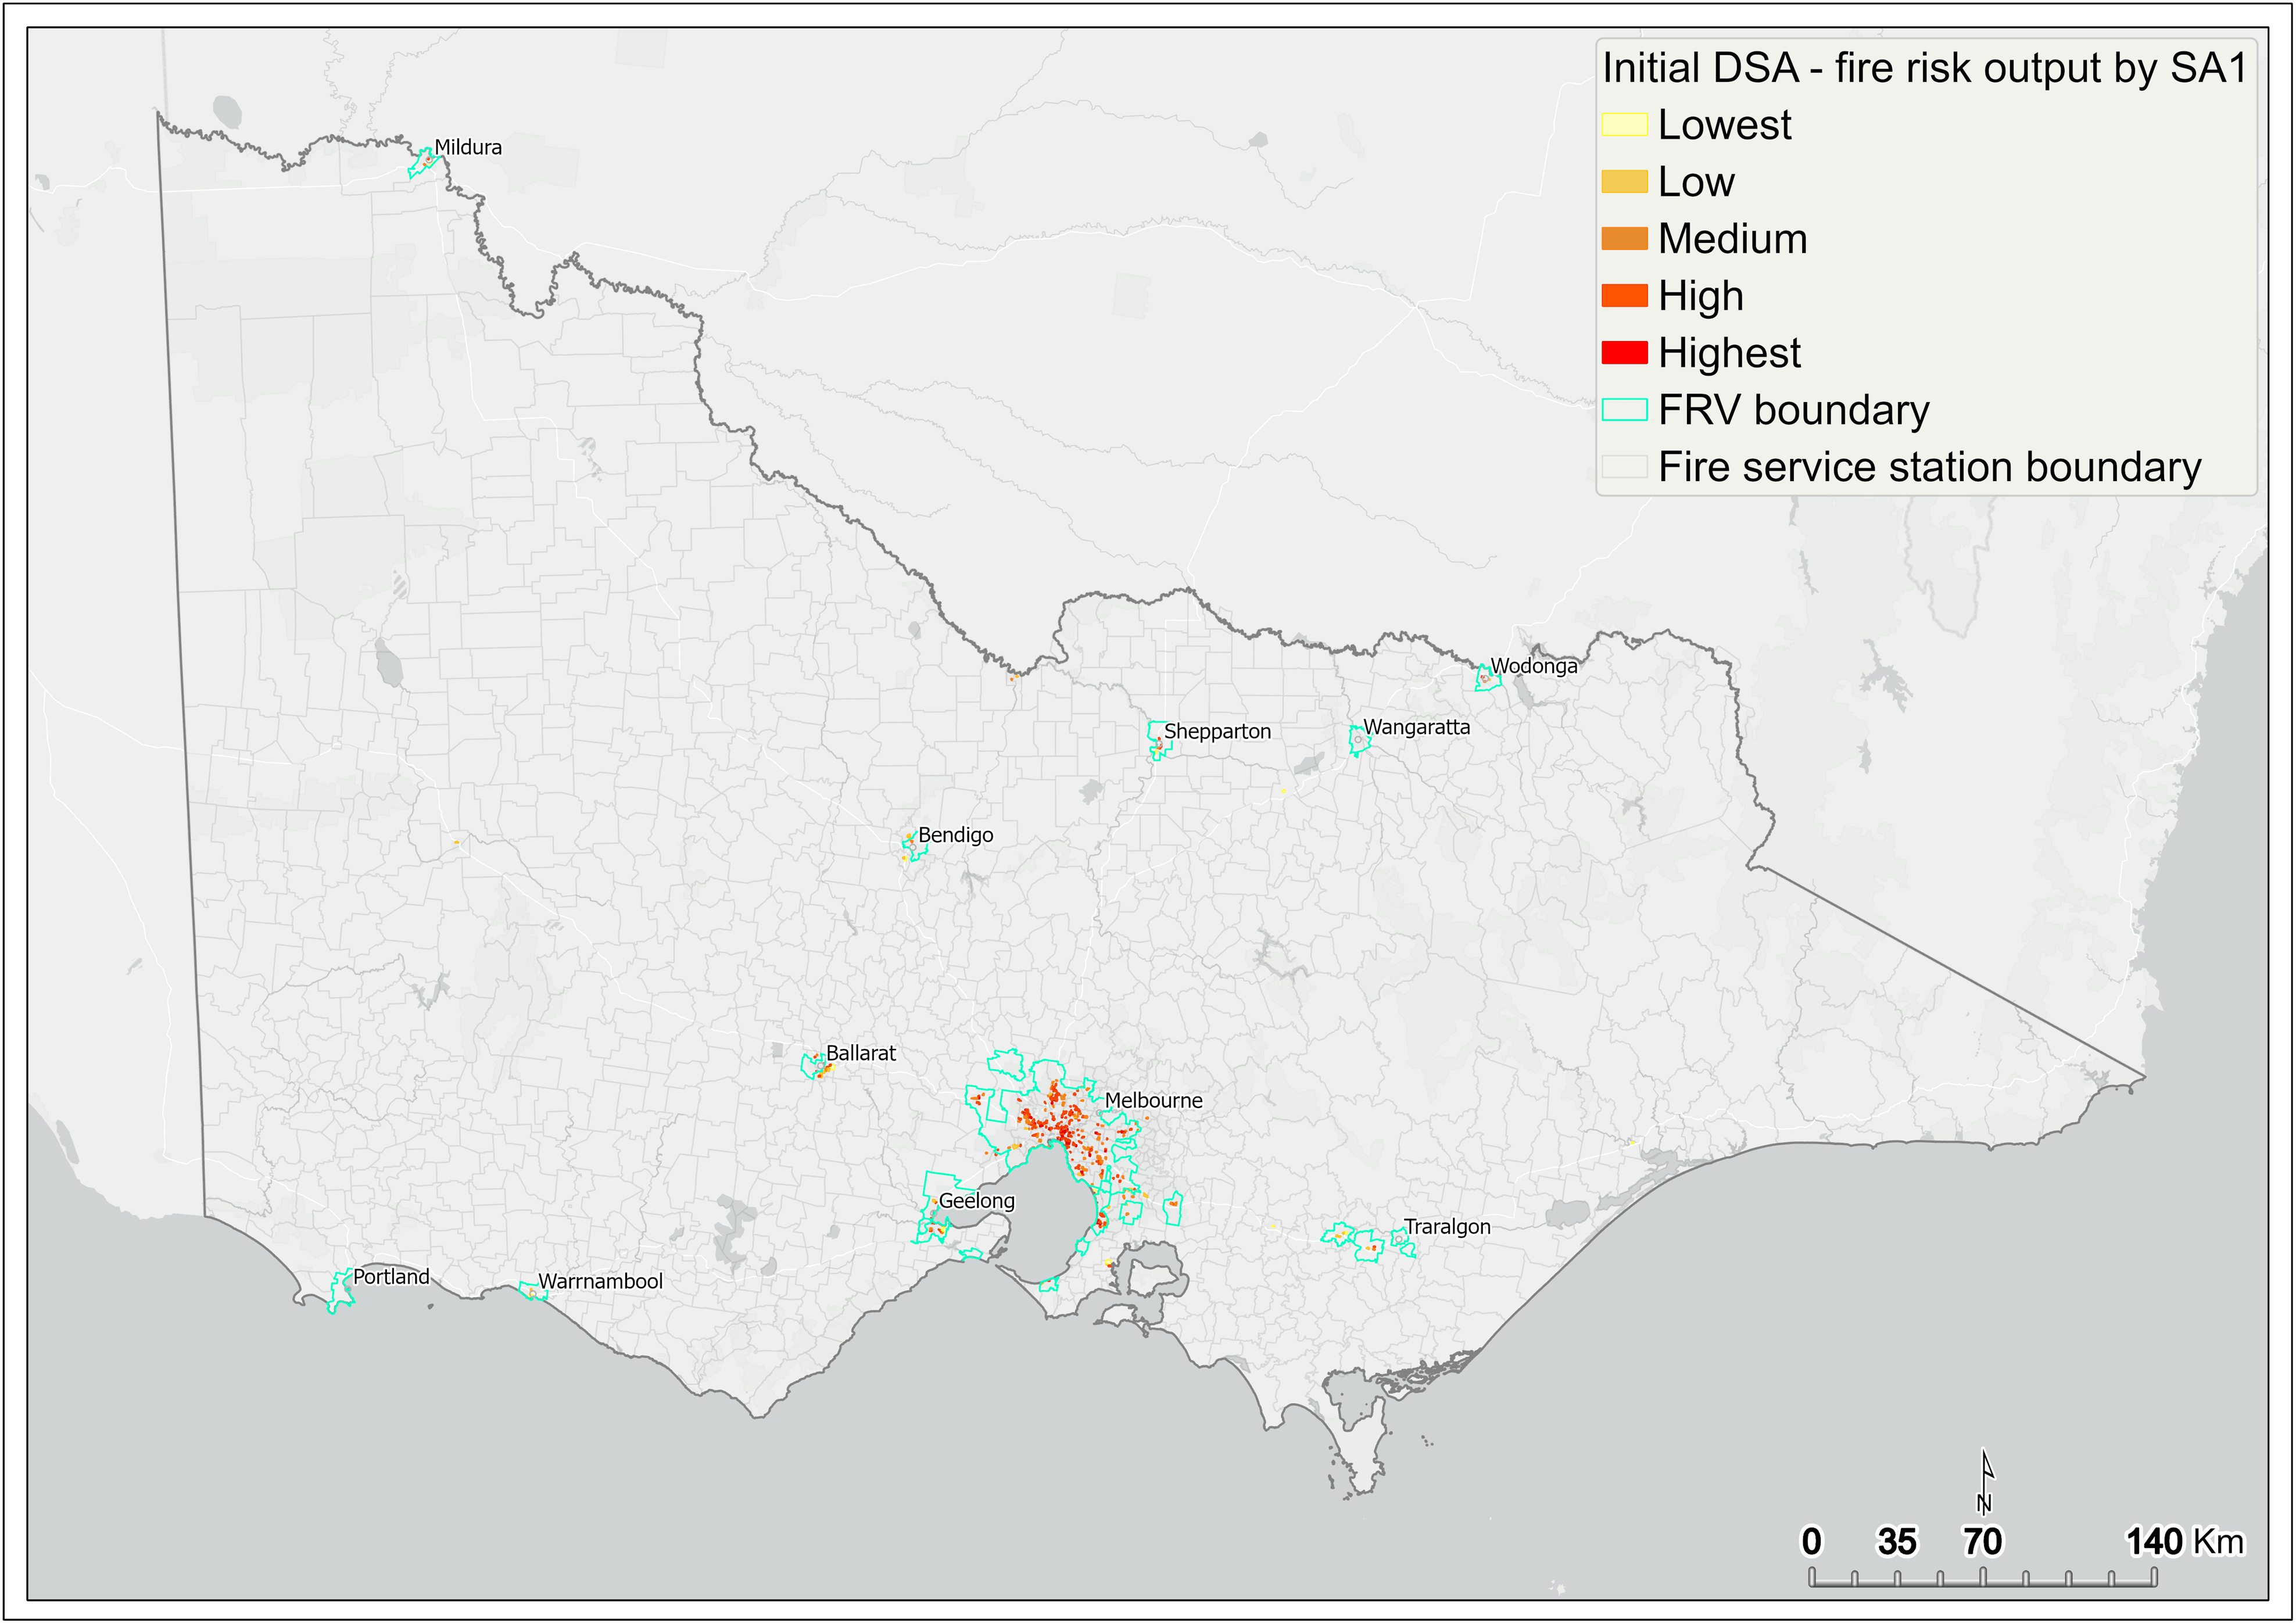
Figure 19 Initial DSA fire risk output by SA1 – metropolitan Melbourne
4. Station response area fire risk
To understand the distribution of fire risk and how it affects the Victorian population, as well as its serviceability by the fire agencies, initial DSA-derived fire risk scores for SA1s are summed within the SRAs.
Victoria has 1,199 SRAs7 (excluding marine response). The initial DSA identified 90 SRAs with a risk score that required further analysis. The final DSA further examined these 90 SRAs and their associated risk in relation to incident type and associated casualties, population projections, planning information, and bushfire risk management to identify the final SRAs for CFA advice. This process is further described in Section 5.
4.1 Casualties by incident type
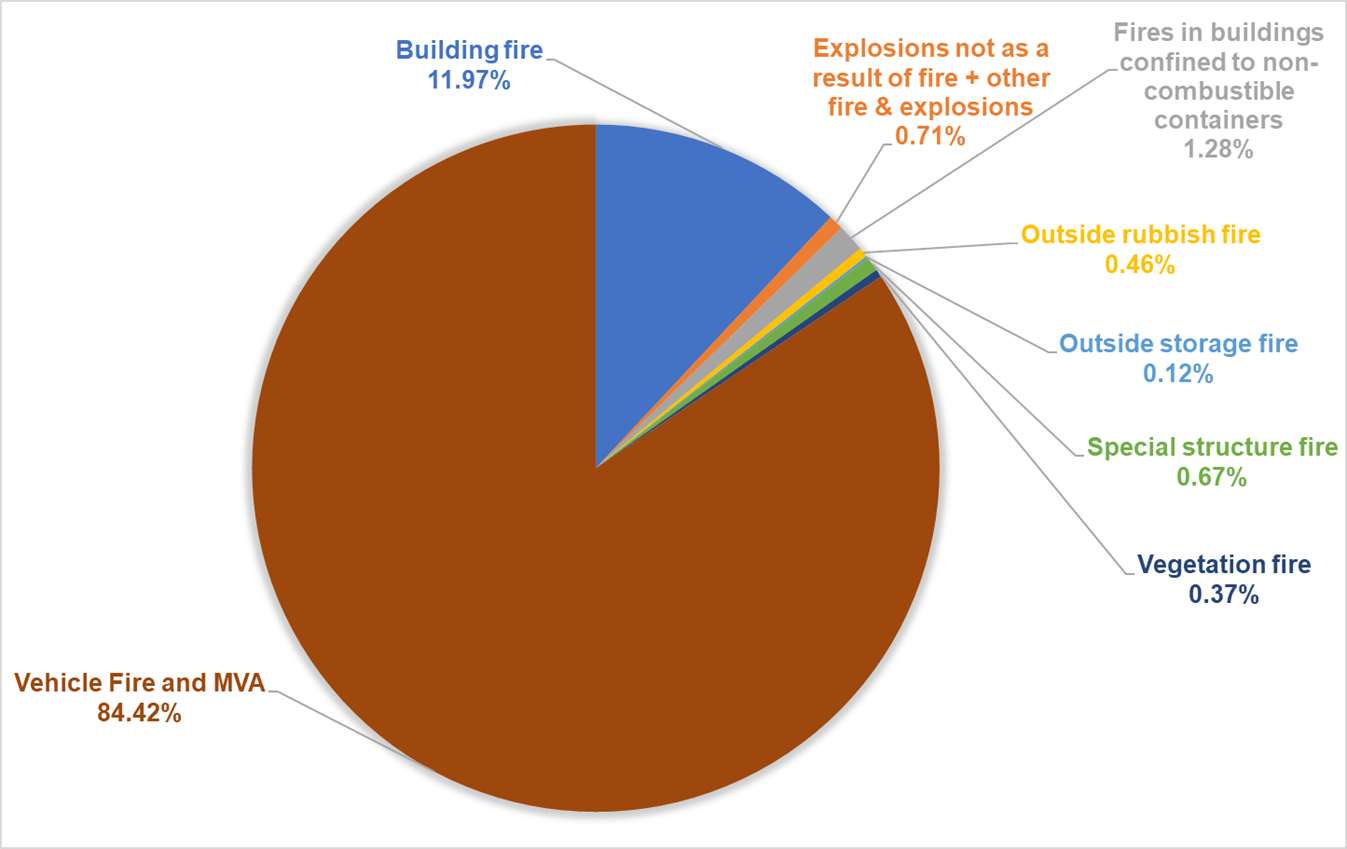
The type of incident and associated casualties are factors that influence this risk. This is particularly relevant for those incidents that are more likely to result in casualties – in this study, building fires, vehicle fires and MVAs (Figure 20).
Figure 20 shows that vehicle fires and MVAs are the main causes of casualties (84.42 per cent), followed by building fires (11.97 per cent). The Pearson correlation coefficient8 indicates that there is a positive relationship between both incident types and casualties for the 90 SRAs. The relationship is stronger for vehicle fires/MVAs:
- Building fires and associated casualties – 0.63 per cent
- Vehicle fires/MVAs and associated casualties – 0.77 per cent.
Figure 20 Percentage casualty by incident type
4.2 Casualty–incident ratios
Based on the analysis in Section 4.1, ratios were calculated for all 90 SRAs of:
- Building fire casualties to total building fires (BCTB)
- Vehicle fire/MVAs casualties to total vehicle fire/MVAs (VCTV).
4.3 Bushfire Management Overlay
BMO9 is a planning control that applies to bushfire-prone areas with very high and extreme bushfire hazards. BMOs trigger planning permit requirements including mandatory bushfire protection measures such as defendable space, water supply, access, and ongoing vegetation management. The area of the SRA that falls within a BMO is calculated as a percentage for each of the 90 SRAs.10
4.4 Population projections
Victoria in Future11 (2019) is the official Victorian Government projection of population and households. Projections are based on trends and assumptions for births, life expectancy, migration, and living arrangements across Victoria. Population growth is one of the major factors contributing to future demand for fire services. Population projection data of 2036 at the Statistical Area Level 2 (SA2)12 is apportioned according to the SRAs that fall within the SA2 boundary for the 90 SRAs.13
4.5 Land use planning
The demand for fire services across the state will be impacted by where population growth and land use changes are occurring.
The declared growth areas of Melbourne have been divided into over 110 precincts, each of which will have a precinct structure plan (PSP) completed to help guide the development of new residential and commercial areas (greenfield).
To investigate where these changes will occur, spatial data14 was sourced from the VPA. This data described:
- The boundaries for regional precincts that are completed or actively being worked on by the VPA
- The boundaries for urban renewal precincts that are completed, or actively being worked on by the VPA.
The area of the SRA overlaid by each VPA project category (greenfield, regional and urban renewal) is calculated as a percentage.15
Footnotes
[7] Represented by the spatial data layer Country Fire Authority (CFA) Brigade Response Polygon. https://datashare.maps.vic.gov.au/search?q=uuid%3Dc2f769a4-ea3f-5f51-82af-473185625c63 and the spatial layer Fire Rescue Victoria (FRV) Maintenance Areas polygon.
[8] A correlation coefficient is a number between −1 and 1 that shows the strength and direction of a relationship between variables. In other words, it reflects how similar the measurements of two or more variables are across a dataset.
[9] https://www.planning.vic.gov.au/policy-and-strategy/bushfire/building-in-the-bmo
[10] https://pro.arcgis.com/en/pro-app/latest/tool-reference/analysis/summarize-within.htm
[11] https://www.planning.vic.gov.au/land-use-and-population-research/victoria-in-future
[12] Statistical Areas Level 2 (SA2s) are geographical areas that are created by combining the smaller SA1s. Their purpose is to capture communities that have social and economic connections with one another. The populations of SA2s range from 3,000 to 25,000 persons. SA2s have an average population of about 10,000 persons and include towns with larger populations.
[13] https://pro.arcgis.com/en/pro-app/latest/tool-reference/analysis/summarize-within.htm
[14] https://vpa.vic.gov.au/wp-content/uploads/2022/02/VPA-Greenfields-PSP-Spatial-Data-Metadata_v5.pdf
https://data-planvic.opendata.arcgis.com/datasets/6fa6b6898e8a41fbbc8a189895e67b1c_0/about
[15] https://pro.arcgis.com/en/pro-app/latest/tool-reference/analysis/summarize-within.htm
5. Selection of station response areas for CFA advice
The 90 SRAs identified as having a high-risk score were further analysed using spatial overlays and ratios. This information built on the attribution of risk based on SA1s and ultimately facilitated identification of the SRAs for which CFA advice is required, using automated and manual methods.
5.1 Final decision support analysis
The final DSA workflow is computed in four steps with the SRAs as the base unit of analysis,16 using a process similar to that explained in Section 3. Each SRA contains all the ratios and overlays outlined in Sections 4.1 to 4.3, which are presented in Table 1.
Table 1 Final decision support analysis criteria, threshold, and influence for 90 station response areas
| Final DSA ratios and overlays | Minimum threshold | Maximum threshold | Influence | Unit |
|---|---|---|---|---|
| Building fire casualties to total building fire ratio | 0.05 | 0.24 | Positive | Ratio |
| Vehicle fire/MVA casualties to total vehicle fire/MVA ratio | 0.19 | 0.59 | Positive | Ratio |
| Proportion of SRA that is bushfire management overlay (BMO) | 0 | 80.86 | Positive | % of SRA |
| Proportion of SRA in each VPA Planning project category | 0 | 100 | Positive | % of SRA |
| Sum of population projections (2036) | 4,449 | 198,680 | Positive | Count |
5.2 Manual selection
To conduct the manual selection process, the ratios and overlays presented in Table 1 were applied to all 90 SRAs. Drawing on the resulting calculations, the SRAs were ranked from highest to lowest according to both ratios and overlays to identify which SRAs were most impacted by these factors. Finally, SRAs that contained high proportions of the identified overlays and high ratio scores were selected for CFA advice.
Interpretation of the final list has been guided by the Index of Relative Socio-economic Disadvantage and general information regarding the localities the station response areas service, including their dominant land use, presence of infrastructure, and population increases that act as potential drivers of fire risk.
Footnotes
[16] Previous DSA application used SA1 as the base unit for analysis
6. Fire District Review Panel determination
Table 2 Station response areas for CFA advice for the FRV Fire District Review 2020–24
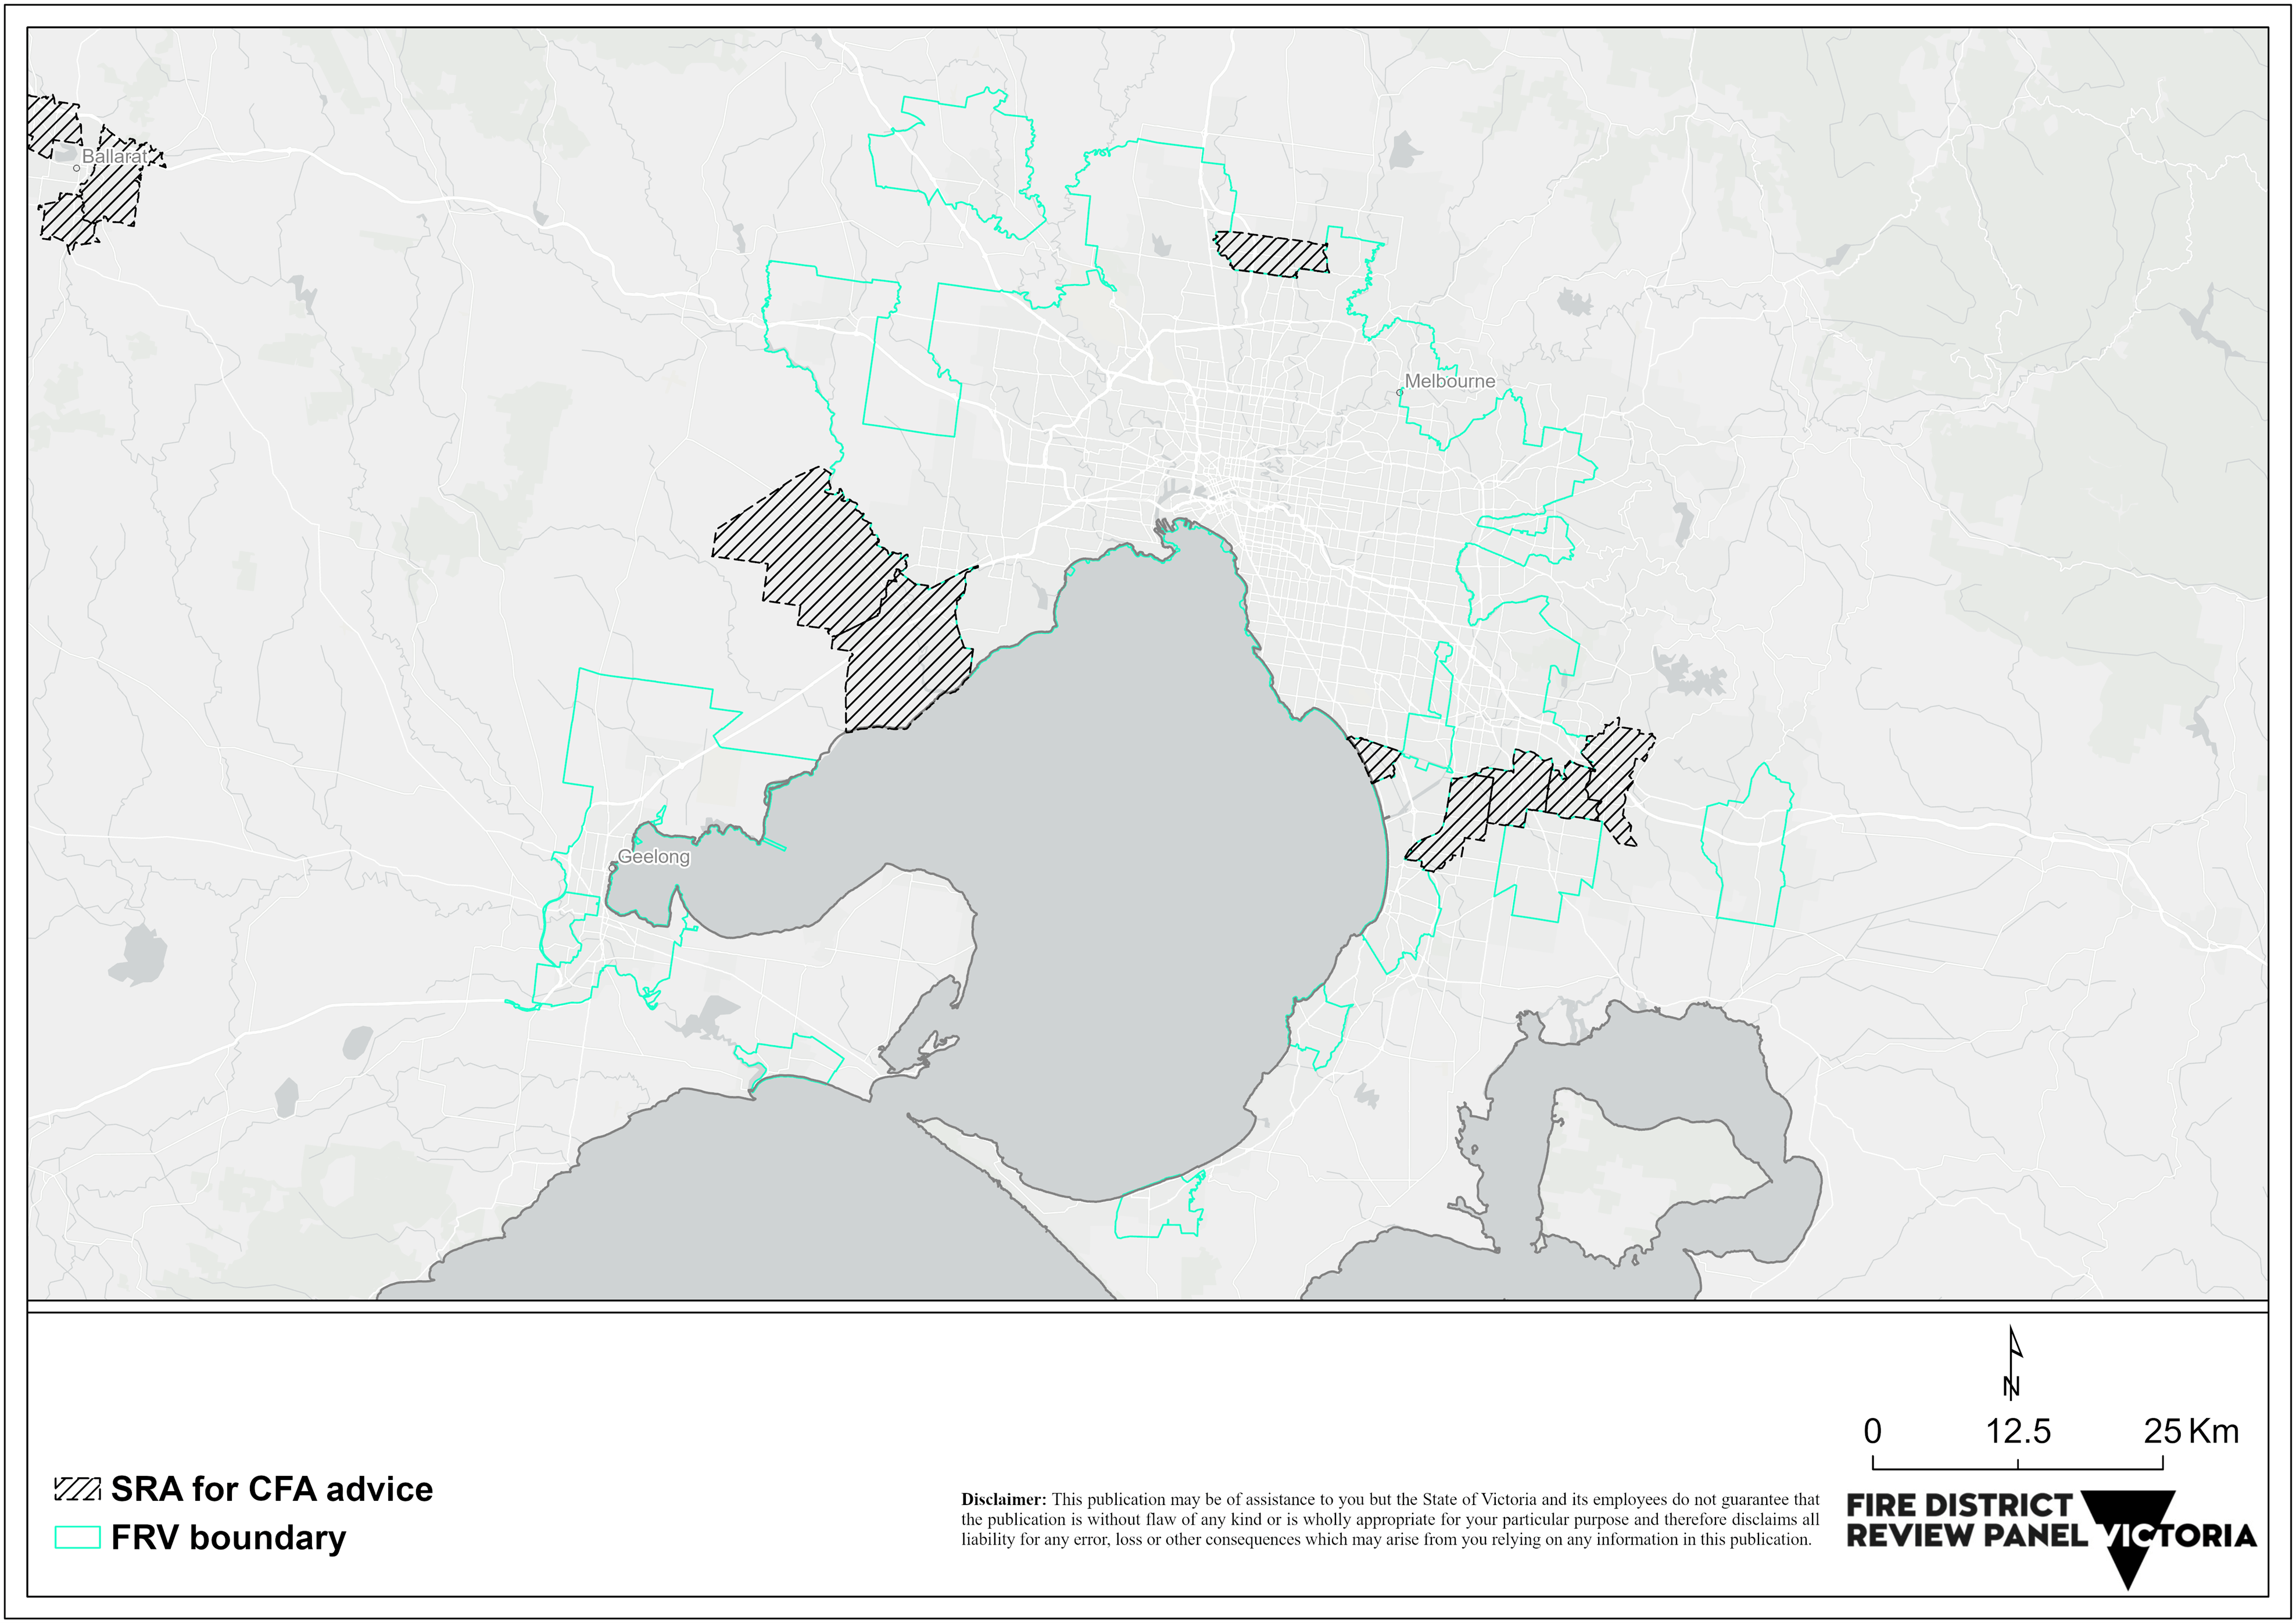
Figure 21 Station response area for CFA advice – statewide
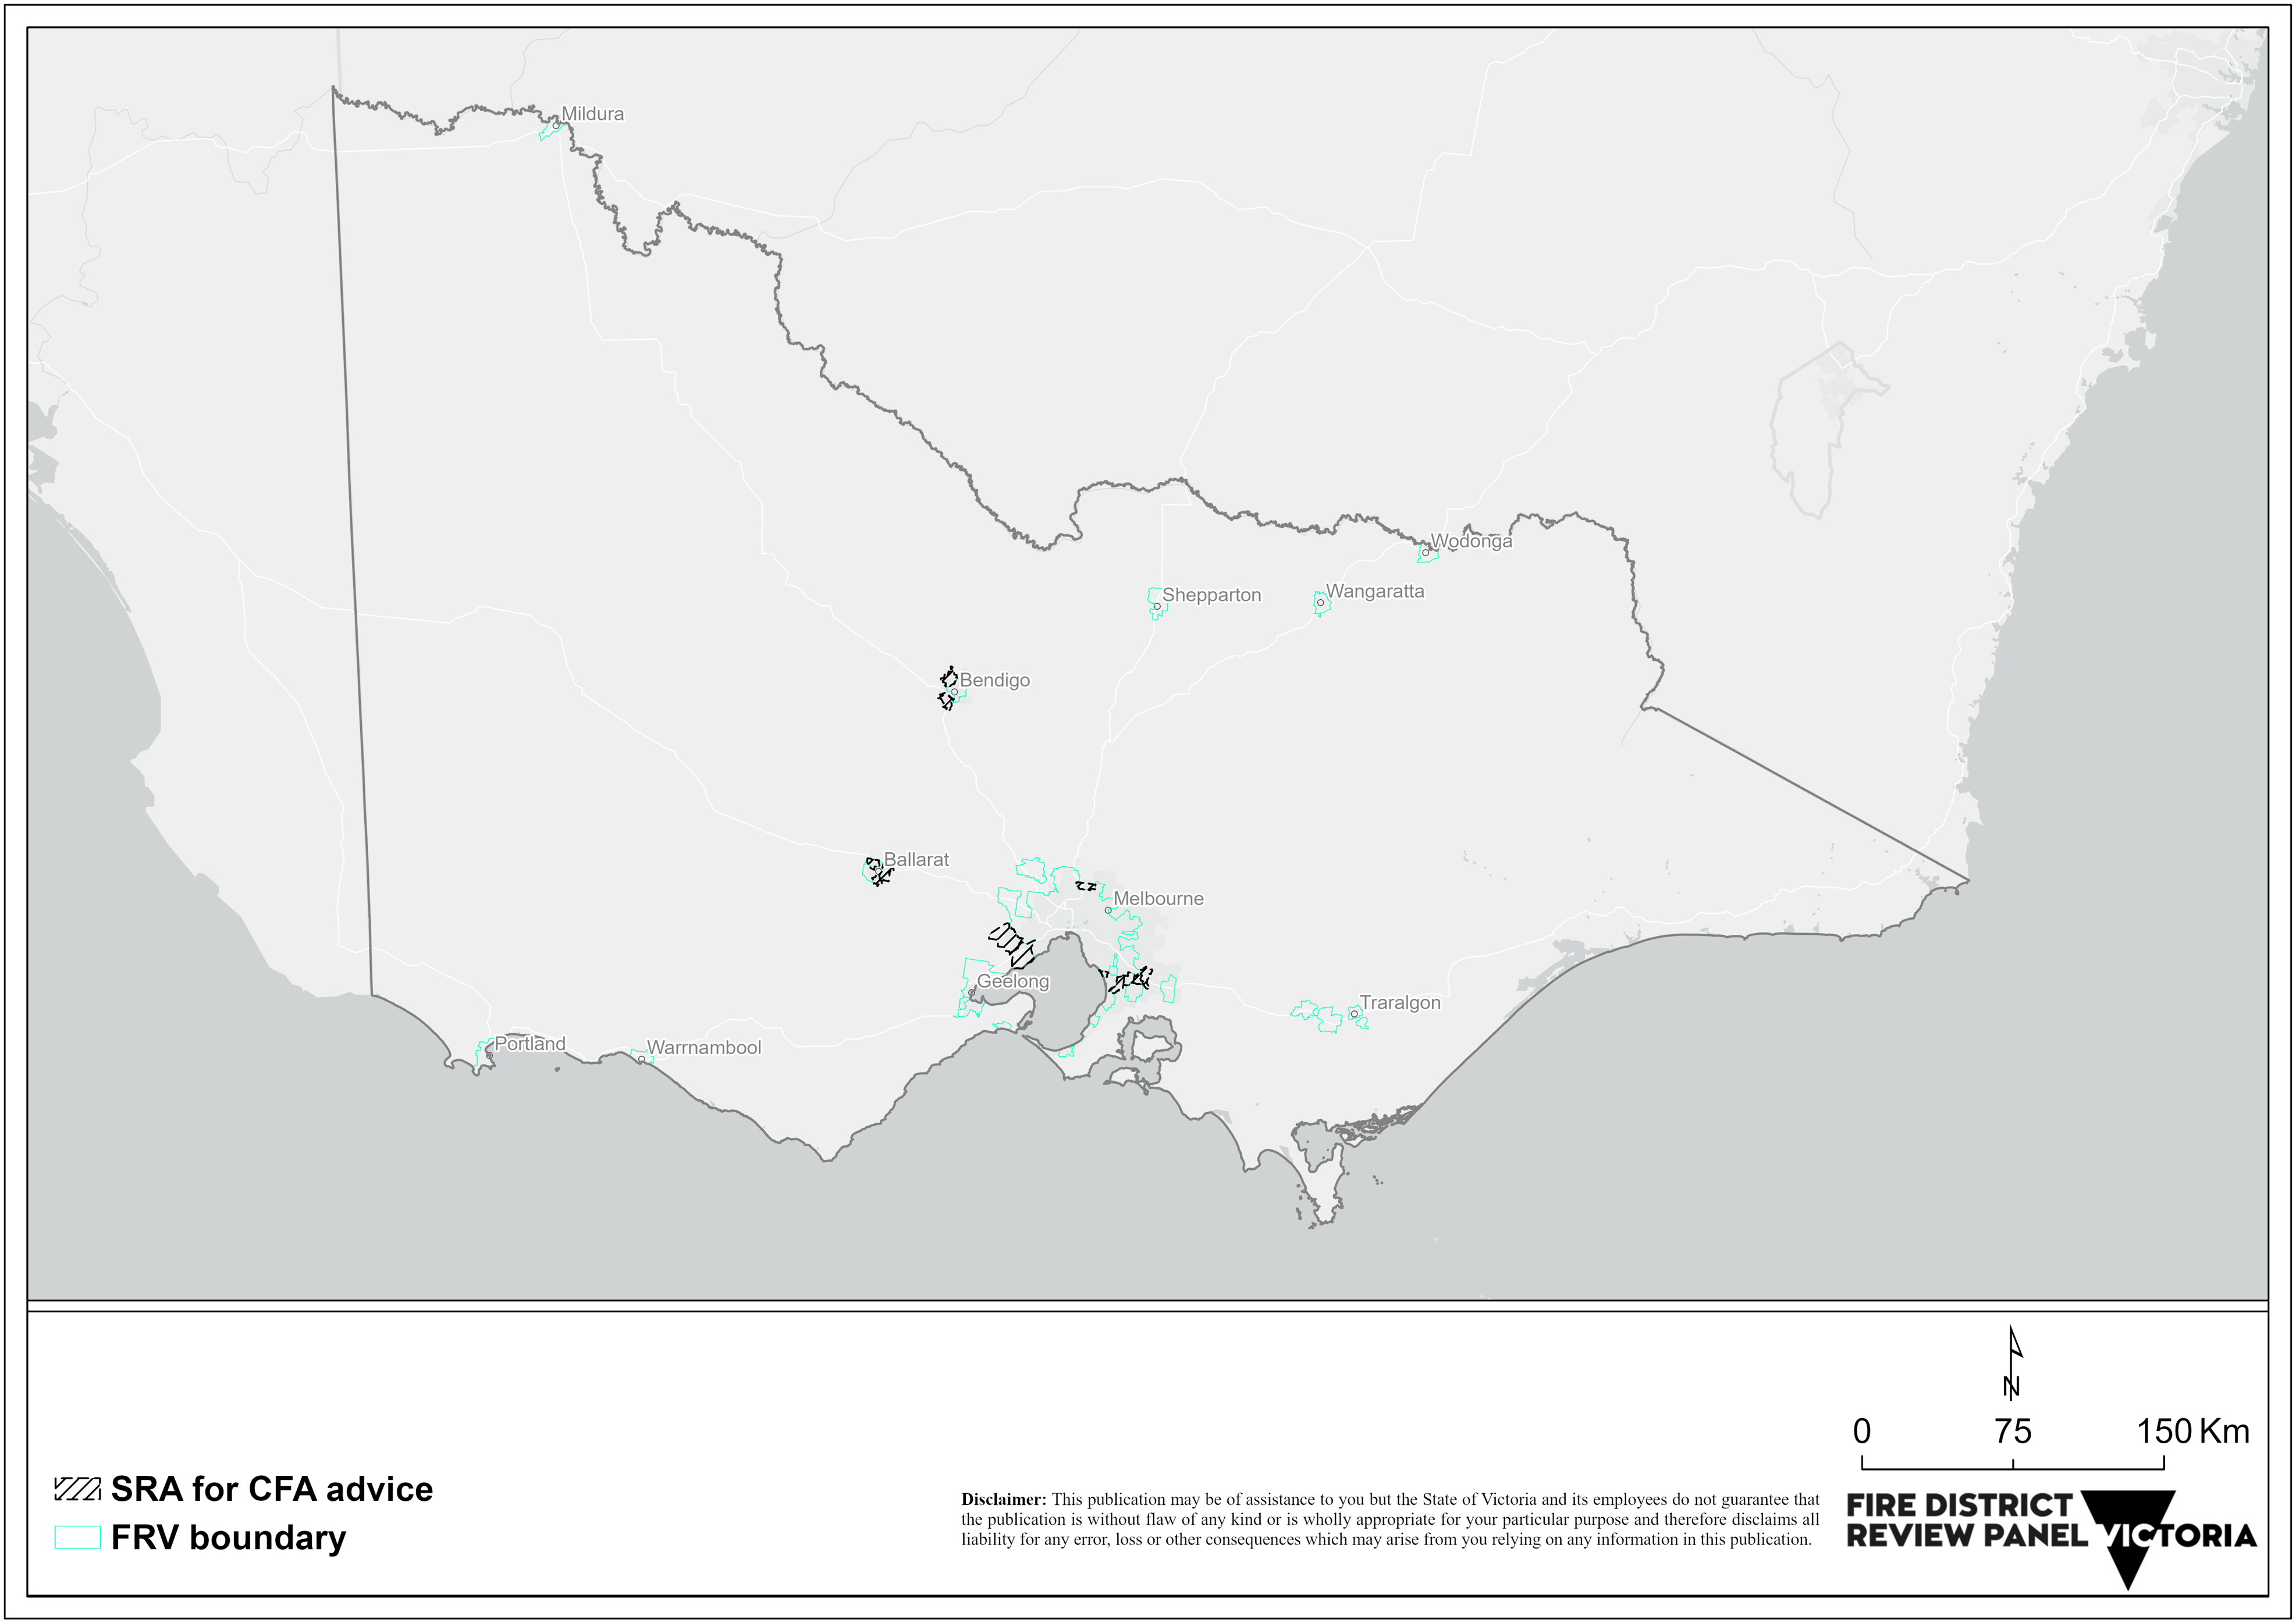
Figure 22 Station response area for CFA advice – metropolitan Melbourne
6.1 Station response areas for CFA advice
Each of the 13 SRAs is described below in terms of their dominant land use, presence of infrastructure, disadvantage, population increases, and the overlays and ratios that serve as potential drivers of fire risk.
6.1.1 District 02
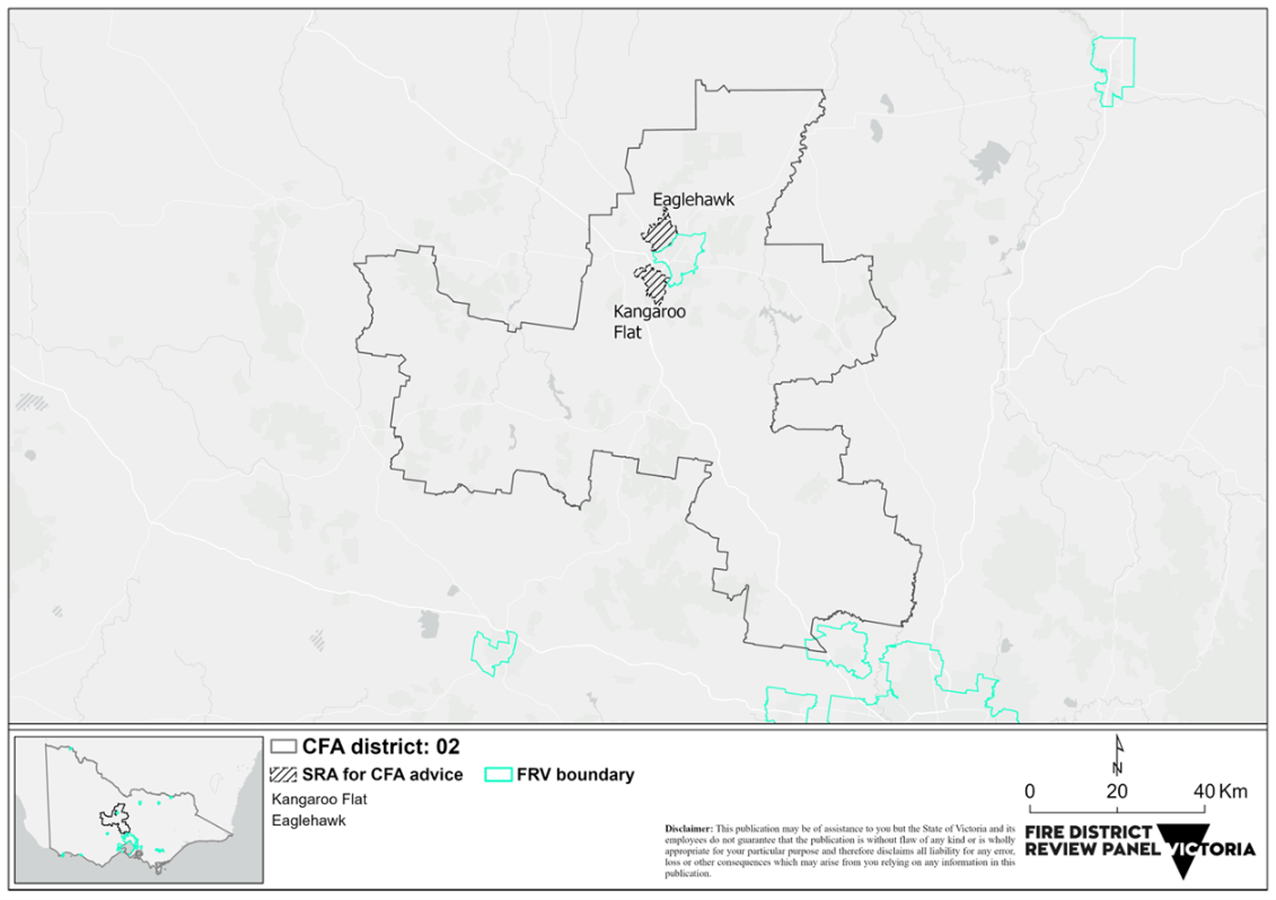
Eaglehawk and Kangaroo Flat SRAs are located in the north-west and south-west, respectively, of Bendigo CBD. Bendigo’s population increased from 86,079 in 2011 to 103,034 in 2021.17 Eaglehawk SRA contains four suburbs,18 of which three (the exception is Sailors Gully) have experienced a population increase since 2011 as follows:
- Eaglehawk – 4,810 in 2011 to 5,538 in 202119
- Sailors Gully – 761 in 2011 to 743 in 202120
- California Gully – 4,263 in 2011 to 4,476 in 202221
- Jackass Flat – 301 in 2011 to 1,907 in 2021.22
The suburb of Kangaroo Flat experienced a population increase from 9,492 in 2011 to 11,328 in 2021.23
Kangaroo Flat SRA is traversed by the Calder Highway and Bendigo railway line, while the Loddon Valley Highway and railway line cut through Eaglehawk SRA. Both SRAs support predominantly residential land use, with areas of commercial industrial land uses throughout.
Kangaroo Flat and Eaglehawk SRAs, respectively, contain 15 and 17 SA1s which rate as the most disadvantaged.24 Kangaroo Flat has the second-highest BCTB ratio of the 90 FRV and CFA SRAs.
In terms of planning, 100 per cent of both SRAs falls into declared regional growth areas, and both record over 80 per cent of their SRA falling into a BMO.
Each SRA contains significant areas of native woody vegetation that form parts of regional parks.
Figure 23 Station response area for CFA advice – District 2
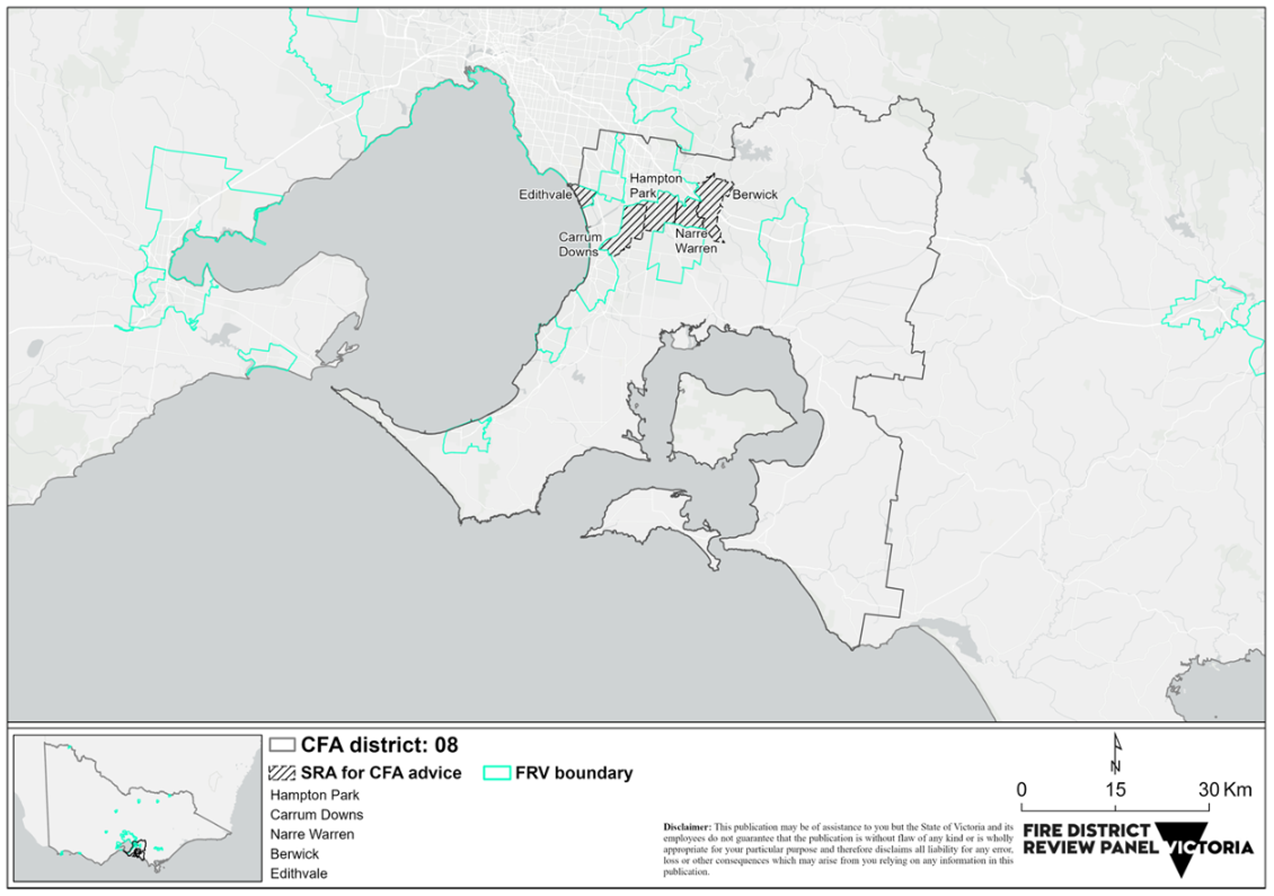
6.1.2 District 08
Carrum Downs SRA contains a mix of residential, industrial, commercial, and agricultural land uses, and contains 14 SA1s rated as the most disadvantaged.
It has the fifth-highest BCTB ratio of the 90 FRV and CFA SRAs. Most notably, it is traversed by several arterials: Frankston-Dandenong Road, Thompson Road, Peninsula Link, and Eastlink.
The population of the suburb of Carrum Downs increased from 19,122 in 2011 to 21,976 in 2021.25
Hampton Park SRA is adjacent to Carrum Downs and Narre Warren SRAs. It encompasses three suburbs: Hampton Park, Lynbrook, and Lyndhurst. These suburbs have experienced population growth as follows:
- Hampton Park – 23,767 in 2011 to 26,082 in 202126
- Lynbrook – 6,772 in 2011 to 9,121 in 202127
- Lyndhurst – 4,896 in 2011 to 8,926 in 2021.28
Hampton Park SRA recorded the third-highest projected 2036 population (>51,000) of CFA SRAs in the 90.
It contains a mix of predominantly residential and industrial land uses, including a recycling plant and landfill.
The SRA is dissected by two major arterials: the South Gippsland Highway and Westernport Highway. It contains 39 SA1s which rate as the most disadvantaged.
Narre Warren SRA contains a large area of Narre Warren South and parts of Narre Warren. It recorded the fifth-highest projected 2036 population (>39,000) across CFA SRAs in the 90.
The population of these suburbs increased as follows:
- Narre Warren – 25,882 in 2011 to 27,689 in 202129
- Narre Warren South – 28,594 in 2011 to 30,909 in 2021.30
The suburb of Narre Warren South has been one of the fastest growing new suburbs in Melbourne over the last twenty years. It has also been one of the major areas of new residential development in the south-east growth corridor.31
Seven SA1s within the Narre Warren SRA rate as the most disadvantaged.
Berwick SRA recorded the second-highest projected 2036 population (>60,000) across CFA SRAs in the 90. Much of its area is residential, with 15 per cent of the SRA falling within greenfield and urban renewal declared growth area. This growth is evident in the south and south-west of the SRA.
There are large areas of parkland and rural lifestyle properties in the north of the SRA. Only five SA1s within the Berwick SRA rate as the most disadvantaged.
The population of the suburb of Berwick increased from 44,779 in 2011 to 50,298 in 2021.32
Considerable industry and infrastructure dominate the centre of the SRA, including the Princes Freeway, Clyde Road, the Pakenham railway line, Federation University, Chisholm Institute, Casey Hospital and St John of God Berwick Hospital. Commercial land use dominates the intersection of the old Princes Highway and Lyall Road.
Edithvale SRA is the smallest of those identified for CFA advice. The SRA encompasses three suburbs – Aspendale, Aspendale Garden, and Edithvale. It contains predominantly residential land use with pockets of commercial areas located either side of the Nepean Highway.
It also includes the Edithvale–Seaford Wetlands in the south of the SRA.
The populations of Edithvale and Aspendale have increased, while that of Aspendale Gardens decreased, as follows:
Figure 24 Station response area for CFA advice – District 8
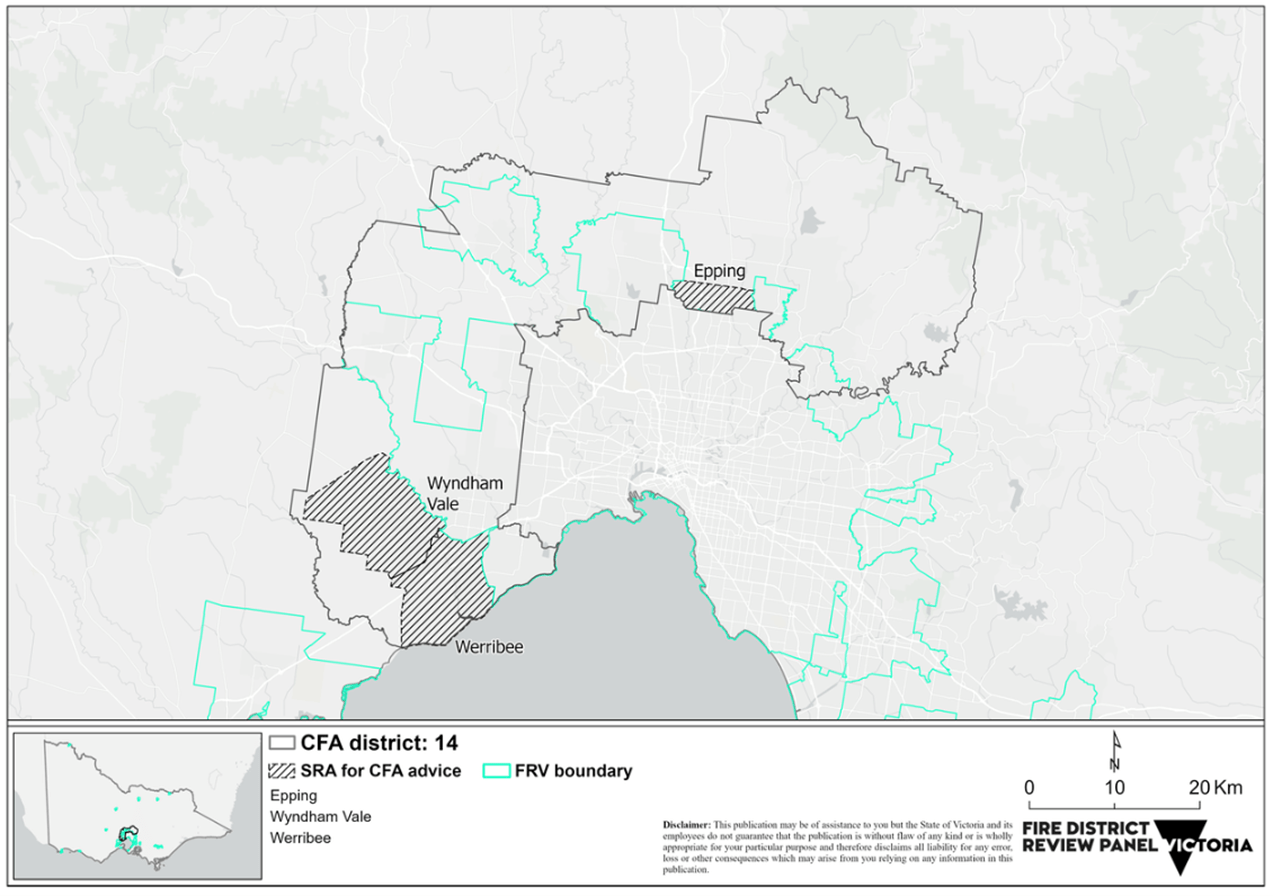
6.1.3 District 14
Nearly half of the Wyndham Vale SRA falls within greenfield declared growth area.
The SRA recorded the highest projected 2036 population of 63,17736 across CFA SRAs. The population of the suburb of Wyndham Vale increased from 17,304 in 2011 to 20,518 in 2021.37
The SRA contains 18 SA1s which rate as the most disadvantaged and has the third-highest BCTB ratio of the 90 FRV and CFA SRAs.
Adjoining Wyndham Vale SRA is Werribee SRA, of which 15 per cent falls within greenfield declared growth area.
Werribee serves as a commuter town in the Melbourne–Geelong growth corridor. It contains three university campuses (Victoria, Notre Dame, and Melbourne) and the Werribee Mercy hospital.
Considerable urban development has occurred in Werribee in recent years, with several high-rise buildings in the city centre.
The population of the suburb of Werribee increased from 37,737 in 2011 to 50,027 in 2021.38
Werribee SRA contains 32 SA1s which rate as the most disadvantaged. It is dissected by the Princess Freeway and has the fifth-highest VCTV ratio of the 90 FRV and CFA SRAs.
Epping SRA contains 13 SA1s which rate as the most disadvantaged. It had the highest BCTB ratio of the 90 FRV and CFA SRAs.
Much of its area is residential, and it recorded the fourth-highest projected 2036 population (>41,000) across CFA SRAs in the 90. The population of the suburb of Epping increased from 26,346 in 2011 to 33,489 in 2021.39
Epping SRA also has large areas of industrial land use and land currently under development. The Hume Freeway, the main arterial linking Melbourne and Sydney, dissects the SRA.
Figure 25 Station response area for CFA advice – District 14
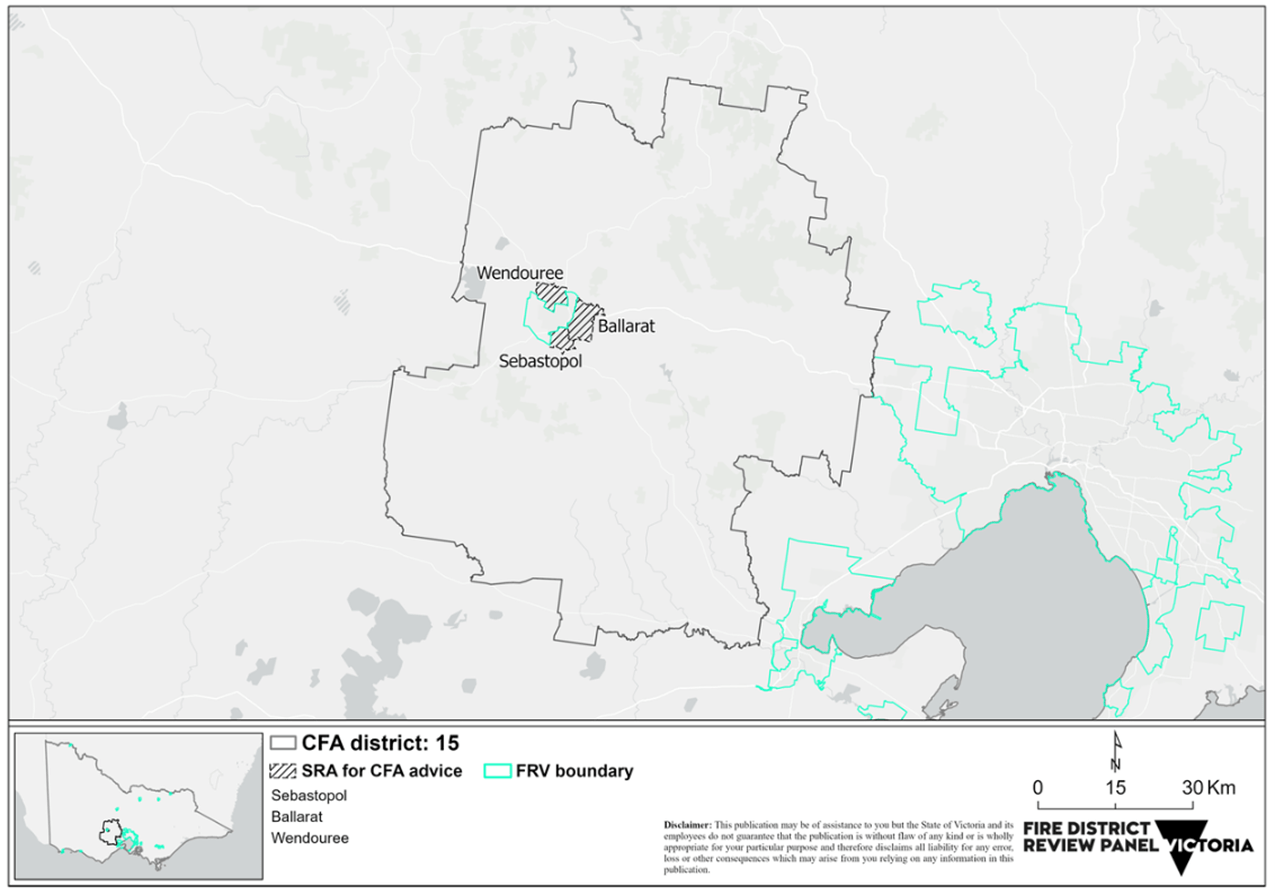
6.1.4 District 15
The population of Ballarat increased from 91,908 in 2011 to 111,973 in 2021.40 Ballarat SRA contains four suburbs, all experiencing population increases since 2011 as follows:
- Ballarat East – 5,309 in 2011 to 5,937 in 202141
- Nerrina – 849 in 2011 to 970 in 202142
- Eureka – 629 in 2011 to 633 in 202143
- Canadian – 3,203 in 2011 to 4,098 in 2021.44
Ballarat SRA is east of Ballarat City and nearly 50 per cent of its area is overlaid by a BMO. The SRA contains the Woowookarung Regional Park in the south-east, a private plantation in the south-west and state forest in the north. It is traversed by the Geelong–Ballarat railway line and the Western Freeway. The SRA is dominated by residential land use; however, Bakery Hill contains a large commercial precinct.
Sebastopol SRA is south of Ballarat City and 36 per cent of its area falls into a declared regional growth area. The population of the suburb of Sebastopol has increased from 9,399 in 2011 to 10,194 in 2021.45 The SRA is traversed by the Midland Highway and is dominated by residential land use but also supports many rural lifestyle properties.
Ballarat and Sebastopol SRAs, respectively, contain 18 and 19 SA1s which rate as the most disadvantaged.
Wendouree SRA is north-west of Ballarat City and traversed by the Western Freeway in the north. It contains large areas of residential and industrial land use, as well as areas to the north and north-west of mixed farming and grazing and rural lifestyle properties. The SRA services 26 SA1s which rate as the most disadvantaged.
Approximately 10 per cent of the Wendouree SRA falls into a declared regional growth area; however, the population of the suburb of Wendouree decreased from 10,596 in 2011 to 10,376 in 2021.46
Figure 26 Station response area for CFA advice – District 15
Footnotes
[17] https://abs.gov.au/census/find-census-data/quickstats/2021/2004 https://abs.gov.au/census/find-census-data/quickstats/2011/2004
[18] There are additional suburbs and localities (SAL) that are part of the Eaglehawk SRA but their population is too low to be recorded in the Census
[19] https://www.abs.gov.au/census/find-census-data/quickstats/2021/SAL20823 https://www.abs.gov.au/census/find-census-data/quickstats/2011/SSC20429
[20] https://www.abs.gov.au/census/find-census-data/quickstats/2021/SAL22224 https://www.abs.gov.au/census/find-census-data/quickstats/2011/SSC21178
[21] https://www.abs.gov.au/census/find-census-data/quickstats/2021/SAL20444 https://www.abs.gov.au/census/find-census-data/quickstats/2011/SSC20233
[22] https://www.abs.gov.au/census/find-census-data/quickstats/2021/SAL21250 https://www.abs.gov.au/census/find-census-data/quickstats/2011/SSC20667
[23] https://www.abs.gov.au/census/find-census-data/quickstats/2021/SAL21293 https://www.abs.gov.au/census/find-census-data/quickstats/2011/SSC20683
[24] The Index of Relative Socio-economic Disadvantage (IRSD) is a general socioeconomic index that summarises a range of information about the economic and social conditions of people and households within an area. This index includes only measures of relative disadvantage.
[25] https://abs.gov.au/census/find-census-data/quickstats/2021/SAL20508 https://abs.gov.au/census/find-census-data/quickstats/2011/SSC20266
[26] https://www.abs.gov.au/census/find-census-data/quickstats/2021/SAL21133 https://www.abs.gov.au/census/find-census-data/quickstats/2011/SSC20591
[27] https://www.abs.gov.au/census/find-census-data/quickstats/2021/SAL21554 https://www.abs.gov.au/census/find-census-data/quickstats/2011/SSC20814
[28] https://www.abs.gov.au/census/find-census-data/quickstats/2021/SAL21555 https://www.abs.gov.au/census/find-census-data/quickstats/2011/SSC20815
[29] https://www.abs.gov.au/census/find-census-data/quickstats/2021/SAL21893 https://www.abs.gov.au/census/find-census-data/quickstats/2011/SSC20985
[30] https://www.abs.gov.au/census/find-census-data/quickstats/2021/SAL21896 https://www.abs.gov.au/census/find-census-data/quickstats/2011/SSC20988
[31] https://reiv.com.au/market-insights/suburb/narre%20warren
[32] https://www.abs.gov.au/census/find-census-data/quickstats/2021/SAL20224 https://www.abs.gov.au/census/find-census-data/quickstats/2011/SSC20125
[33] https://www.abs.gov.au/census/find-census-data/quickstats/2021/SAL20848 https://www.abs.gov.au/census/find-census-data/quickstats/2011/SSC20446
[34] https://www.abs.gov.au/census/find-census-data/quickstats/2021/SAL20079 https://www.abs.gov.au/census/find-census-data/quickstats/2011/SSC20037
[35] https://www.abs.gov.au/census/find-census-data/quickstats/2021/SAL20080 https://www.abs.gov.au/census/find-census-data/quickstats/2011/SSC20038
[36] This was calculated using the summarise within command (in ArcGIS Pro) following intersection of the 2036 projection data with the CFA SRA spatial layer.
[37] https://abs.gov.au/census/find-census-data/quickstats/2021/SAL22883 https://abs.gov.au/census/find-census-data/quickstats/2011/SSC21513
[38] https://abs.gov.au/census/find-census-data/quickstats/2021/SAL22750 https://abs.gov.au/census/find-census-data/quickstats/2011/SSC21452
[39] https://abs.gov.au/census/find-census-data/quickstats/2021/SAL20878 https://abs.gov.au/census/find-census-data/quickstats/2011/SSC20466
[40] https://abs.gov.au/census/find-census-data/quickstats/2021/2003 https://abs.gov.au/census/find-census-data/quickstats/2011/2003
[41] https://www.abs.gov.au/census/find-census-data/quickstats/2021/SAL20112 https://www.abs.gov.au/census/find-census-data/quickstats/2011/SSC20058
[42] https://www.abs.gov.au/census/find-census-data/quickstats/2021/SAL21917 https://www.abs.gov.au/census/find-census-data/quickstats/2011/SSC20999
[43] https://www.abs.gov.au/census/find-census-data/quickstats/2021/SAL20891 https://www.abs.gov.au/census/find-census-data/quickstats/2011/SSC20475
[44] https://www.abs.gov.au/census/find-census-data/quickstats/2021/SAL20461 https://www.abs.gov.au/census/find-census-data/quickstats/2011/SSC20242
[45] https://www.abs.gov.au/census/find-census-data/quickstats/2021/SAL22255 https://www.abs.gov.au/census/find-census-data/quickstats/2011/SSC21198
[46] https://www.abs.gov.au/census/find-census-data/quickstats/2021/SAL22745 https://www.abs.gov.au/census/find-census-data/quickstats/2011/SSC21451
7. Conclusion
Fire risk has been assessed across Victoria. The assessment has considered incident data from both fire agencies, FRV and CFA, for the period 2010 to 2019. The use of spatial and statistical techniques demonstrated the distribution of fire risk across the state at the SA1 scale. Attributing SA1 risk estimates to SRAs facilitated interpretation at an operational level.
A final list containing SRAs for which CFA advice is required is derived from broader considerations, such as planning, bushfire, population projections, and the incidents resulting in the greatest number of casualties. Interpretation of the final list has been guided by the IRSD and general information concerning the localities served by the SRAs.
Appendix A
Limitations, assumptions, and considerations
Methods
- This work does not establish a change in fire risk between ‘TIME A’ and ‘TIME B’ using incident data. It establishes a baseline that facilitates assessment of a ‘TIME A’ and ‘TIME B’ risk change for the next review.
- The analysis of MVAs was introduced late in the analysis. Therefore, only kernel density estimation (KDE) analysis was undertaken on the MVAs, rather than them being part of the entire incident dataset, on which the various spatial techniques were undertaken.
- This methodology is not static. It will continue to be enhanced and adjusted as more research is undertaken and more data becomes available.
Data
- Not all incidents serviced by the CFA and FRV are considered by this report. Only incidents classified as fire and explosion data or MVAs are considered.
- False alarm data was examined to understand the demand pattern for such incidents; however, the result from that analysis was not directly used in the review process.
- Because the ABS variables were only available in SA1 scale, the base unit for fire risk analysis was conducted on the SA1 scale. Future reviews may employ a grid-based analysis or SRA-based analysis.
- SDS is different for FRV and CFA. To implement a consistent approach to the analysis of response time, response time data was only used to ascertain whether the SDS was met or failed for each incident. As a result, there was no requirement for the Emergency Services Telecommunications Authority (ESTA) data.
- FRV and CFA have different terms to describe the area that individual stations respond to. As a result, the term ‘station response area’ or SRA has been used in this report.
- Hydrant data was not used in this analysis but remains a planning consideration if boundaries are to be changed.
- Only human impact, in terms of casualty47 as a result of fire, is considered in this work. Economic impact is not considered. Property loss estimates recorded at the time of incident by the fire services are not sufficient for analysis, and insurance estimate data are not available at the SA1 scale.
- When providing population estimates for suburbs from the ABS Census, the suburb boundaries do not align with the SRA boundaries. As a result, the population statistics do not exactly represent the population demand of the SRA.
- This review used population projections for 2036 at the SA2 scale. Population projection for 2036 was captured for each SRA based on the proportion of SRA falling within the SA2s.
- Coronial data, which could provide an insight to deaths that did not occur at the time of the fire but after a period of time, was not considered in this review.
- Street network data (HERE data) was not utilised as part of this review. Access to this data is recommended for future reviews to enable enhanced spatial accessibility and coverage analysis.
- Regression modelling results conducted at SA1 scale was not included in this review. Future reviews may consider a different approach in regression modelling (for example, a point-based regression modelling).
Footnotes
[47] Casualty = Injury + death
Appendix B
Initial decision support analysis criteria, threshold, and influence
Table A1 shows the thresholds (minimum and maximum) and influence of the input criteria.
Table A1 Initial decision support analysis criteria, threshold, and influence
| Criteria | Minimum threshold | Maximum threshold | Influence | Unit |
|---|---|---|---|---|
| Fire rate | 36 | 475 | Positive | Rate |
| Fire hot spot | 0 | 3 | Ideal (0) | Significance level |
| Fire KDE | 3 | 5 | Positive | KDE value |
| Fire risk estimation | 0.51 | 1 | Positive | Probability |
| Casualty | 0 | 13 | Ideal (0) | Count |
| SDS failures | 1 | 144 | Positive | Count |
| MVA KDE | 3 | 5 | Positive | KDE value |
Thresholds are determined by inspecting the outputs outlined in Sections 2.4 and 2.5. The median values for fire rate, fire KDE, Markov Chain Estimation (MCE) and MVA KDE are input as the minimum threshold, and the maximum value for each of these outputs is input as the maximum threshold. More simply, the data between the fiftieth percentile and one hundredth percentile for these outputs is used for subsequent input to the initial DSA as it represents the areas of the state with elevated fire risk. Conversely, the minimum threshold for fire hot spot and casualty is taken from their minimum value, and their maximum value is the maximum threshold.
For SDS failures, the minimum threshold is one and maximum threshold is maximum value.
The differences in the minimum thresholds for casualties and SDS failure address the potential consequences of a single casualty (that is, death or significant injury) and SDS failure (that is, the SDS threshold considers time taken to flashover).
Likewise, for hot spots, an ideal situation would see statistically insignificant hot spots of fire (that is, zero value) across Victoria.
Therefore, a minimum threshold is taken from the minimum value considering the influence of this criterion. These minimum and maximum values (outputs from Sections 2.4 and 2.5) are presented in Table A1, and each criterion is defined as having a positive or ideal influence on the initial DSA score.
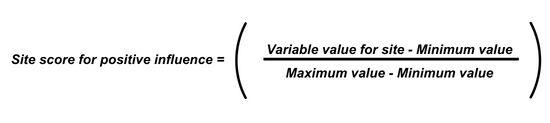
Positive influence means that the higher the value of the variable, the greater its effect on the score. This is calculated as the variable value for a site minus the minimum value for that variable, divided by the range of values (Equation 1).
Equation 1
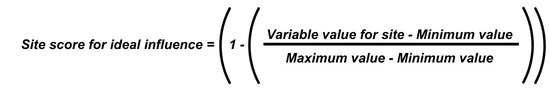
Ideal influence defines an ideal value for the variable. The closer the value of the variable to the specified ideal, the greater its effect on the score. This is calculated as the ideal value for a variable minus the variable value for a site, divided by the difference between either the ideal and the minimum, or the ideal and the maximum (whichever value is greater) (Equation 2).
Equation 2