2.2.1 FRV: Response to structure fire incidents within 7.7 minutes
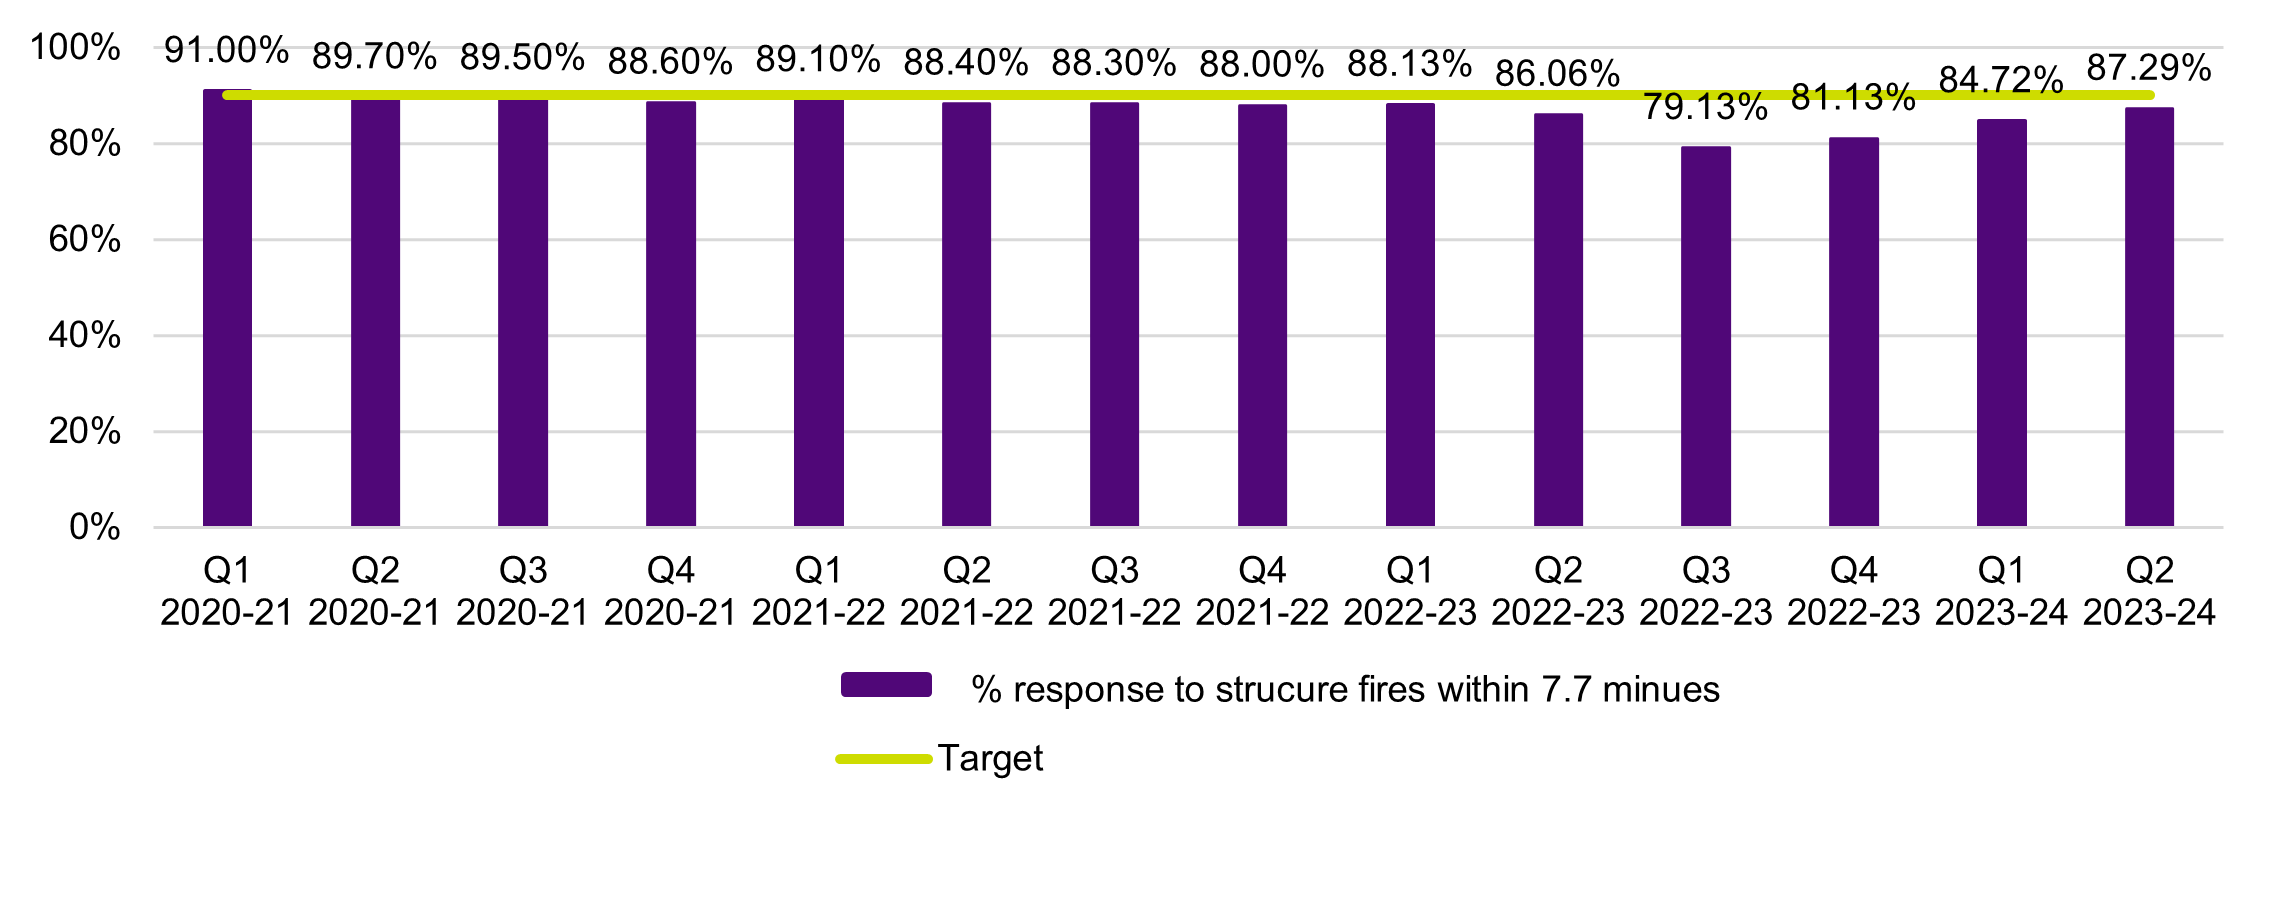
For the thirteenth consecutive quarter, FRV did not meet their target for this measure (90 per cent), recording a result of 87.29 per cent for response times to structure fire incidents within 7.7 minutes (Figure 3).
FRV report that the physical location of structure fire incidents, and the time it takes to reach these locations, rather than the type of structure fire incidents (e.g. residential or commercial buildings), has the most impact on response times. FRV’s analysis on response times for structures fires from October to December 2023 is as follows:
- 122 of 960 incidents attended missed the benchmark (resulting in the 87.29 per cent result this quarter).
- Of these 122 incidents, 38 (31 per cent) occurred outside of 6.2 minute drive time from an FRV station.
- Additionally, of the other 84 incidents which missed the benchmark, almost half (49 per cent) were attended first by appliances dispatched from a station outside of the Maintenance Area where the incident was recorded. This likely resulted in FRV having to travel excess distances to reach the incident.
Data note
As reported in Q1 2023-34, prior to the December 2022 cyber-attack, FRV reported this measure by sourcing data from AIRS. Since Q2 2022-23, FRV has used data obtained from TZV CAD system to report this result. FRV advised that TZV CAD data has been validated to ensure its integrity and comparability. FRV reported that comparative analysis confirmed the difference between the two data sets (using TZV CAD data instead of AIRS data) did not materially affect results. Figure 3 represents results reported using AIRS data for results between Q1 2020-21 to Q1 2022-23 and TZV CAD data for results reported between Q2 2022-23 to Q2 2023-24.
Figure 3: 2.1.3a Percentage of response to structure fire incidents within 7.7 minutes (target 90 per cent)

2.2.2 FRV: Increase in support and maintenance of firefighters’ physical and psychological health
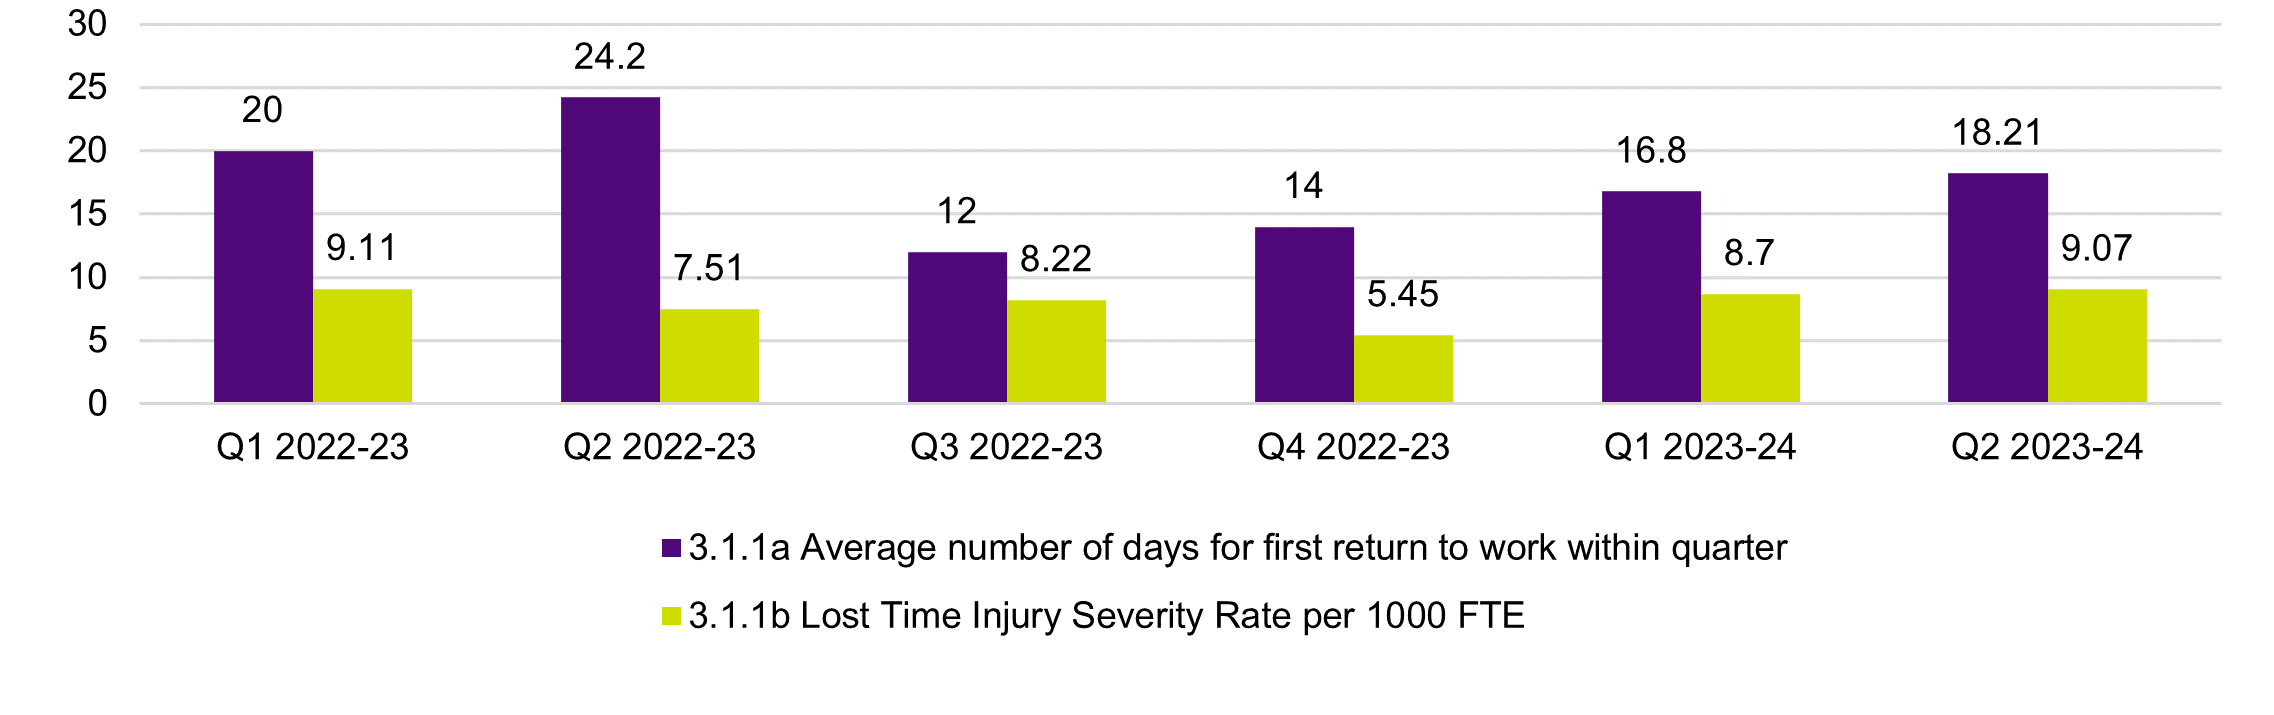
FRV continues to record reduced performance in measures ‘3.1.1a Average number of days for first return to work within quarter’ and ‘3.1.1b lost time injury severity rate per 1000 FTE’.
FRV’s measure ‘3.1.1a average number of days for first return to work within quarter’ recorded an 8.39 per cent increase in Q2 2023-24 (18.21 days) compared to Q1 2023-24 (16.8 days). FSIM also notes that results for this indicator displays a continuous upward trend since Q3 2022-23, demonstrating reduced performance (Figure 4).
FRV’s measure ‘3.1.1b: Lost time injury severity rate per 1000 FTE’ calculates the number of injuries reported into FRV’s claims database categorised as Lost Time Injuries (one or more working days/shifts lost due to injury). This quarter's result of 9.07 lost working days/shifts due to injury per 1000 FTE is a 4.25 per cent increase from the Q1 2023-24 result of 8.7 and a 20.8 per cent increase from its year-on-year Q2 2022-23 result of 7.51 (Figure 4).
As reported in Q1 2023-24, FRV advised FSIM that although the results show reduced performance, FRV does not consider this to be a meaningful indicator to understand workforce health and safety due to the way the indicator is measured (e.g. it does not account for claims lodged at the end of the quarter). FRV has reported to FSIM that the work to review health, safety and wellbeing metrics as part of the FRV Health Model program implementation will allow for more meaningful reporting of occupational health and safety under this measure in future.
Figure 4: 3.1.1: Increase in support and maintenance of firefighters’ physical and psychological health, measures 3.1.1a Average number of days for first return to work within quarter, 3.1.1b Lost time injury Severity Rate per 1000 FTE

2.2.3 CFA: Decrease average time spent suppressing structure fires (time spent on scene of incident)
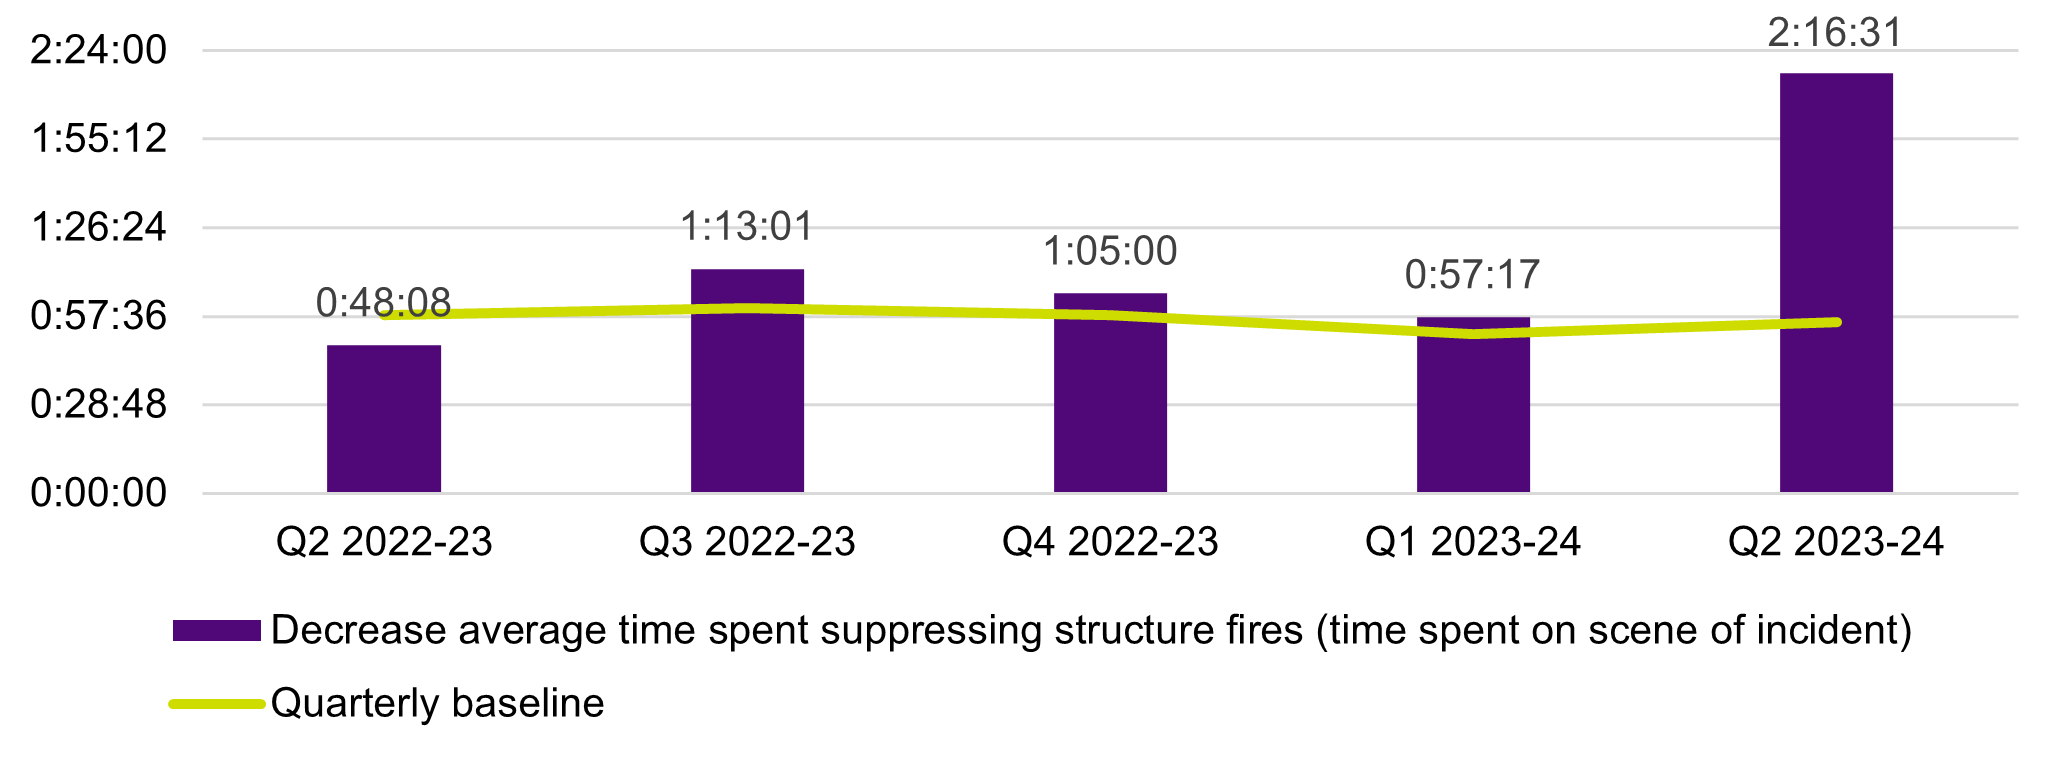
CFA has not met the baseline for this indicator since Q2, 2022-23 (Figure 5).
CFA recorded a result of 136 minutes and 31 seconds this quarter. This is an 83 minutes and 56 seconds increase on the quarterly baseline and represents a continuous off-track trend for this indicator.
CFA report that this increase is due to a number of hayshed fires during the reporting period, which can take days to extinguish. CFA’s result this quarter, with the top ten outliers removed from the overall result, is 64 minutes and 5 seconds, which is an 8 minutes and 30 seconds increase on the quarterly baseline. CFA did not observe any other trends or factors that contributed to this quarter’s results.
As noted previously, CFA advise there are many factors that can influence this result that are not easily evaluated quarter-on-quarter. These factors include fire progression at time of arrival, structure type, timeline of support services such as utilities, and the presence of hazardous materials.
Figure 5: 2.2.3 Decrease average time spent suppressing structure fires (time spent on scene of incident)

Updated