This report is informed by the Country Fire Authority’s (CFA) and Fire Rescue Victoria’s (FRV) respective outcomes framework progress updates for the quarter 3 (Q3) 2023-24 reporting period (1 January to 31 March 2024).
This quarter, CFA reported on all 26 quarterly indicators from its 2023-24 CFA Year Four Outcomes Framework and FRV reported on 18 measures against 12 indicators from the FRV Outcomes Framework.
FRV’s December 2022 cyber-attack continues to affect data availability and its ability to report against all outcome framework indicators. FSIM understands FRV continues to work to restore its IT systems (Australian Incident Reporting System (AIRS) and FireCode) for future reporting will be restored in the 2024-25 FY and advises that FireCode will now be restored by September 2024.
Protected industrial actions at the CFA and FRV continue to affect data quality for some FRV indicators, such as indicators relating to the capture and reporting of false alarms and fleet availability.
CFA and FRV results are reported by exception under FSIM’s reporting criteria:
Demonstrates a notable achievement:
- CFA met baseline for indicator ‘Decrease in average time to control bushfires’ (2.2.4) and has shown continuous improvement over the last four quarters, demonstrating a notable achievement.
- CFA indicator ‘Increase in percentage of grass and scrub fires contained to 5 hectares’ (2.2.2) has met baseline for the first time since Q2 2022-23.
- FRV measure ‘Percentage of emergency medical response (EMR) within 9.2 minutes’ (2.1.3a) has met target for the fifteenth consecutive quarter.
Continuing off-track trend over repeated quarter:
- CFA’s indicator ‘Decrease average time spent suppressing structure fires (time spent on scene of incident)’ (2.2.3) has not met baseline since Q2 2022-23.
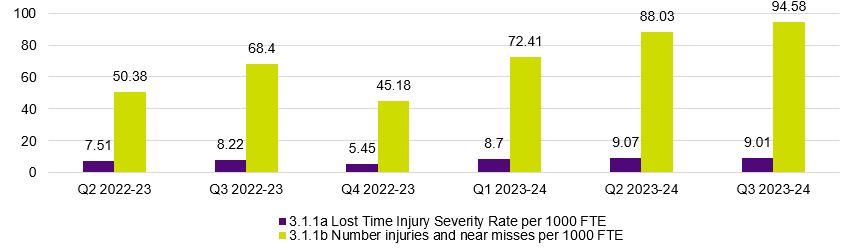
- FRV’s measure ‘Number of injuries and near misses per 1000 FTE’ (3.1.1a), which informs the indicator ‘Increase in support and maintenance of firefighters’ physical and psychological health’ (3.1.1) has seen a steady reduction in performance since Q4 2022-23.
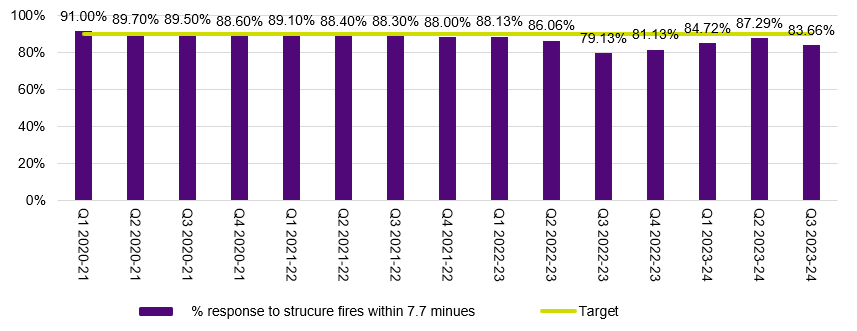
- FRV’s measure ‘Percentage of response to structure fire incidents within 7.7 minutes’ (2.1.3a) did not meet target for the fourteenth consecutive quarter.
Significant change from the previous quarter (positive or negative):
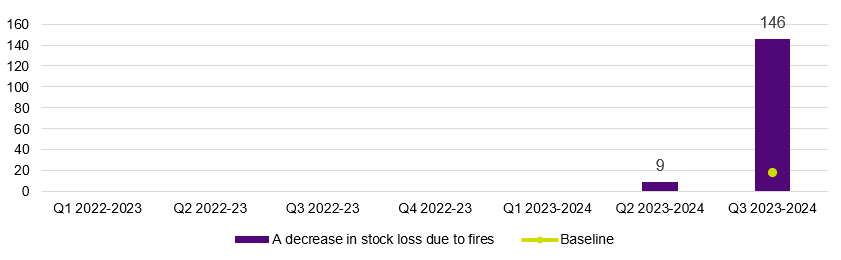
- CFA’s indicator ‘Decrease in stock loss due to fires’ (2.3.4) recorded an increase of 137 stock lost compared to the previous quarter.
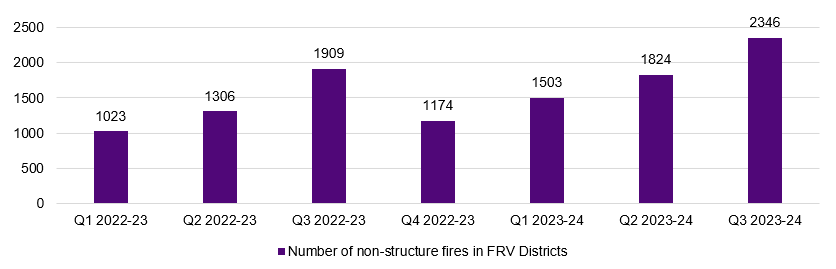
- FRV’s measure ‘Number of incidents other than structure fires and other non-fire related incidents within FRV districts: non-structure fires’ (1.3.3) recorded an increase of 522 non-structure fires this quarter.
FSIM acknowledges CFA and FRV for their ongoing cooperation and active contribution to FSIM’s monitoring and reporting activities.
1. Summary
This report is prepared and published in accordance with the Fire Services Implementation Monitor’s (FSIM) requirements under section 141 of the Fire Rescue Victoria Act 1958 (FRV Act). It provides commentary and analysis on the Country Fire Authority’s (CFA) and Fire Rescue Victoria’s (FRV) respective outcomes frameworks for quarter 3 (Q3) of the 2023-24 financial year (FY).
FSIM publishes these quarterly reports at Fire Services Implementation Monitor publications.
1.1 Reporting on outcomes
CFA and FRV have each developed an outcomes framework that sets out their respective outcomes-based fire services performance measures, in accordance with section 140(1) of the FRV Act.
This quarter, CFA reported on 26 indicators in their newly released Year Four Outcomes Framework, and FRV reported on 18 measures (against 12 indicators) in their existing Year Three Outcomes Framework.
CFA and FRV’s Q3 2023-24 outcomes progress reports are provided in Appendices A and B, respectively.
Changes to FSIM’s outcomes reporting criteria
FSIM revised its outcomes reporting criteria to streamline reporting this quarter. As such, the criterion ‘varies more than 5 per cent from the agency’s baseline or average over time’ will no longer be reported as a stand-alone criterion but will be considered within the parameters of the three criteria below.
Under these criteria, FSIM has identified the following notable indicators and measures for the quarter:
- demonstrates a notable achievement:
- CFA: Decrease in average time to control bushfires (indicator 2.2.4).
- CFA: Increase in percentage of grass and scrub fires contained to 5 hectares (indicator 2.2.2).
- FRV: Percentage of response to EMR (emergency medical response) within 9.2 minutes (target 90%) (measure 2.1.3a).
- continuing off-track trend over repeated quarter:
- CFA: Decrease average time spent suppressing structure fires (time spent on scene of incident) (indicator 2.2.3).
- FRV: Increase in support and maintenance of firefighters’ physical and psychological health (indicator 3.1.1).
- FRV: Percentage of response to structure fire incidents within 7.7 minutes (target 90 per cent) (measure 2.1.3a).
- significant change from the previous quarter (positive or negative):
- CFA: A decrease in stock loss due to fires (indicator 2.3.4).
- FRV: Number of incidents other than structure fires and other non-fire related incidents within FRV districts: non-structure fires (measure 1.3.3).
1.2 Maturing outcomes frameworks
CFA and FRV regularly review their respective outcomes frameworks to ensure the outcomes, indicators and measures continue to align with their strategic priorities and remain fit-for-purpose.
CFA’s outcomes framework
CFA advises that it continues to mature the way in which it uses performance data to inform decision-making. CFA undertakes an annual review of its Outcomes Framework which includes consultation with data stewards across the agency, and then formal consideration by the CFA Executive and Board. CFA report that minimal changes were implemented to provide greater clarity and transparency to reporting.
The following indicators were removed:
- Decrease in new volunteer compensation claims (previously reported as indicator 3.1.3)
- Decrease in new WorkCover claims (previously reported as indicator 3.1.4)
- Increase in timely resolution of internal audit recommendations (previously reported as indicator 4.2.2).
FRV’s outcomes framework
FRV commenced a review of the Outcomes Framework to consider potential structure, scope, and alignment with their Strategic Plan. The work is scheduled to be completed by the end of May 2025.
FRV removed the measure ‘Average number of days for first return to work within quarter’ (formally 3.1.1a). FRV previously reported (Q2 2023-24) the indicator as an ineffective measure of workforce health and safety as it did not account for the claims lodged at the end of the quarter.
1.3 Issues impacting data quality and data availability
Industrial action impacting data quality
Data quality for some FRV indicators continues to be affected by industrial action. For instance, FRV reports that false alarm data informing the measure ‘Number of properties with six or more false alarms on different days (rolling 12 months)’ are impacted by the ongoing Triple Zero Victoria industrial action since 18 December 2023. This action resulted in arbitrary coding of false alarms. FRV also note that the industrial actions by FRV staff reported in Q1 and Q2 continue to impact the rolling 12-month figures reported for this measure. FRV advise that the Q3 results for this measure are not appropriate for comparison with previous quarters.
As reported in Q2 for the measure ‘2.1.3b: Total operational fleet availability’, FRV report that protected industrial action taken by CFA District Mechanical Operators has meant that FRV cannot access total fleet availability data in regions for formal reporting. CFA note however this industrial action did not impact on appliance-related emergency response or related activities. As industrial action was lifted in February 2024, FSIM will continue to monitor this indicator in future reports.
FRV report that Q3 data reported for measure 2.1.3b reflects appliances in metropolitan Melbourne only.
FRV cyber-attack impacts on outcomes framework reporting
The December 2022 cyber-attack continues to impact FRV’s access to the Australian Incident Reporting System (AIRS) and FireCode reporting system. As reported previously, FRV cannot provide results for all operational measures.
FRV report on the following impacted measures using validated data from the TZV Computer Aided Dispatch (CAD) system:
- Number of properties with six or more false alarms on different days (rolling 12 months)
- Number of structure fire incidents
- Number of incidents other than structure fires and other non-fire related incidents
- Percentage of response to structure fire incidents within 7.7 minutes
- Percentage of response to EMR (emergency medical response) within 9.2 minutes.
FRV advise AIRS will be restored for reporting in the 2024-25 FY, and FireCode reporting system will not meet its previously reported deadline of June 2024 and is expected to be fully recovered by 30 September 2024.
2. CFA and FRV outcomes frameworks – Q3 results
2.1 Demonstrates a notable achievement
Notable achievements recorded for: CFA’s 2.2.4 Decrease average time to control bushfires; CFA’s 2.2.2 Increase in percentage of grass and scrub fires contained to 5 hectares; FRV’s 2.1.3a Percentage of emergency medical response within 9.2 mins.
2.2 Continuing off-track trend over repeated quarters
Measures record off-track trend over repeated quarters: CFA’s 2.2.3 Decrease average time suppressing structure fire; FRV’s 3.1.1 Increase support for firefighter health; FRV’s 2.1.3a Percentage response to structure fire within 7.7 mins.
2.3 Significant change from the previous quarter (positive or negative)
Measures record significant change from previous quarter: CFA’s 2.3.4 Decrease in stock loss due to fires; FRV’s 1.3.3 Number of incidents other than structure fires and other non-fire related incidents within FRV districts: non-structure fires.
2.1 Demonstrates a notable achievement
In this section, FSIM reports on CFA and FRV indicators and measures that meet FSIM’s reporting criteria.
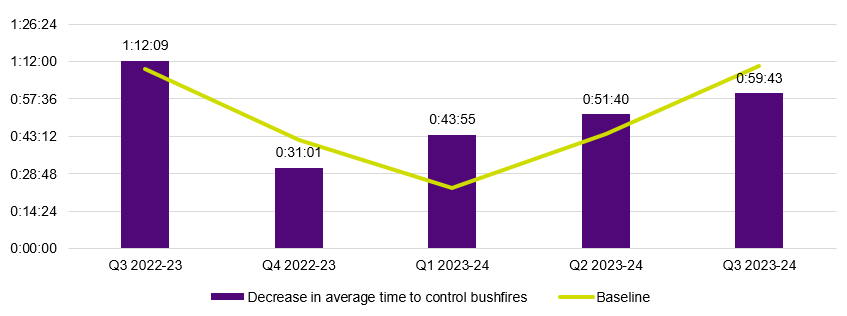
2.1.1 CFA: Decrease in average time to control bushfires (indicator 2.2.4)
CFA reported a decrease in average time to control bushfires representing a positive outcome for the community.
CFA recorded a result of 59 minutes and 43 seconds this quarter, well below the quarterly baseline of 70 minutes and 26 seconds (Figure 1). This is a notable achievement considering increased bushfire activity this reporting period.
CFA advised improvement in the average time to control bushfires is likely linked to the increase in fires contained to 5 hectares. CFA noted there were a number smaller fires requiring less time for containment.
Figure 1: 2.2.4 Decrease in average time to control bushfires
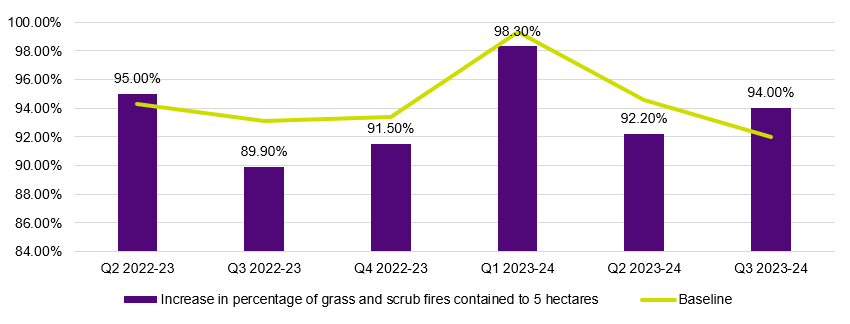
2.1.2 CFA: Increase in percentage of grass and scrub fires contained to 5 hectares (indicator 2.2.2)
CFA reported an increase in percentage of grass and scrub fires contained to 5 hectares, representing a positive outcome for the community (Figure 2).
This quarter’s result of 94 per cent is 1.8 per cent higher than the quarterly baseline of 92.2 per cent. This is also the first time CFA has met or exceeded the quarterly baseline for this indicator since Q2 2022-23. FSIM noted that CFA recorded a total of 750 grass and scrub fires in Q3 (indicator 2.1.2).
CFA noted in addition to the operational response and tactics employed, there are a number of environmental and circumstantial factors that influence the ability to contain fire spread and extinguish fires, such as the size of the fire at detection, location of the fire (including accessibility and the terrain), weather conditions, and availability of resources. CFA advised that no direct connections can be made to any specific factors for the positive result in Q3.
Figure 2: 2.2.2 Increase in percentage of grass and scrub fires contained to 5 hectares
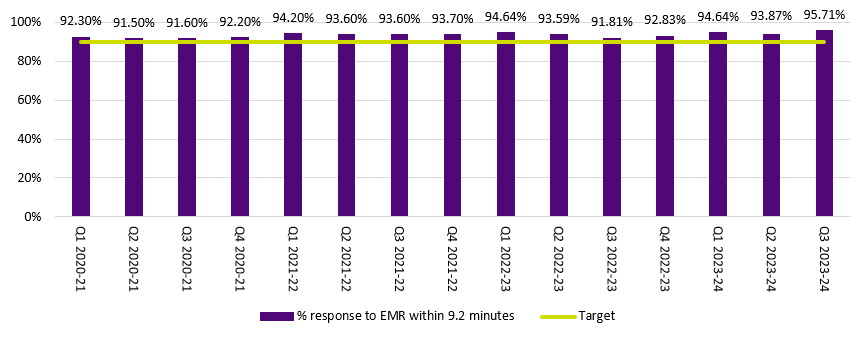
2.1.3 FRV: Percentage of emergency medical response (EMR) within 9.2 minutes (target 90 per cent) (measure 2.1.3a)
FRV exceeded target for this measure for fifteen consecutive quarters demonstrating a notable achievement.
In Q3, FRV recorded a result of 95.71 per cent, which is its highest result recorded (Figure 3). FSIM notes that FRV responded to a total of 1446 EMR incidents in FRV districts (measure 1.3.3) and 160 EMR incidents outside of FRV districts (measure 3.4.1b).
Data note
The results below are reported using AIRS data from Q1 2020-21 to Q1 2022-23 and TZV CAD data from Q2 2022-23 to Q3 2023-24.
2.1.3 FRV: Percentage of emergency medical response (EMR) within 9.2 minutes (target 90 per cent) (measure 2.1.3a)
2.2 Continuing off-track trend over repeated quarters
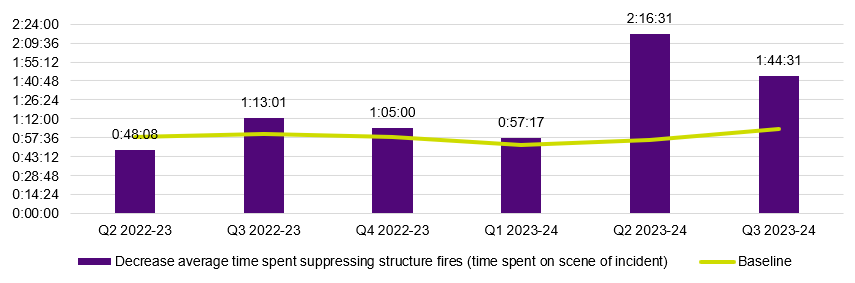
2.2.1 CFA: Decrease average time spent suppressing structure fires (time spent on scene of incident) (indicator 2.2.3)
CFA has not met the baseline for this indicator since Q2, 2022-23 (Figure 4).
CFA recorded a result of 104 minutes and 31 seconds this quarter. This is an increase of 40 minutes and 21 seconds on the quarterly baseline of 64 minutes and 10 seconds.
CFA advised there were several hayshed fires during the reporting period. Hayshed fires impact reporting data as they require a significant amount of time to extinguish.
Figure 4: 2.2.3 Decrease average time spent suppressing structure fires (time spent on scene of incident)
2.2.2 FRV: Increase in support and maintenance of firefighters’ physical and psychological health (indicator 3.1.1)
As identified in section 1.2 Maturing Outcomes Frameworks above, FRV has reduced the measures being reported against under the indicator 3.1.1. FRV now only report on the following two measures.
Measure ‘3.1.1a Lost time injury severity rate per 1000 FTE’, FRV recorded a result of 9.01 this quarter, representing a similar result to Q2 2023-24 (Figure 5).
Measure ‘3.1.1b: Number of injuries and near misses per 1000 FTE’, FRV recorded a result of 94.59 this quarter compared to 88.03 in Q2 2023-24 (Figure 5). This is the highest recorded result for this measure. FRV report that the increase of injuries from over Q1 and Q2 2023-24 are in part related to psychological exposure reports which are now classified as incidents/injuries rather than hazards.
Figure 5: 3.1.1: Increase in support and maintenance of firefighters’ physical and psychological health.
2.2.3 FRV: Percentage of response to structure fire incidents within 7.7 minutes (target 90 per cent) (measure 2.1.3a)
For the fourteenth consecutive quarter, FRV did not meet its target of 90 per cent. This quarter, FRV responded to 83.66 per cent of structure fire incidents within 7.7 minutes (FRV measure 2.1.3a) (Figure 6).
FRV report attending to a higher number of structure fire incidents in Q3 compared to the previous quarter. In Q3, FRV responded to 1113 structure fires incidents within FRV districts, an increase of 109 since Q2, and 211 structure fire incidents outside of FRV districts, an increase of 18 since Q2.
FRV report that with increased demand, and an increased number of responses to events outside FRV districts (see FRV measure 3.4.1), the level of operational availability (appliance at station, ready to respond) was reduced in certain areas requiring some crews to travel further to reach incidents where the local station is otherwise occupied.
Data note
As AIRS is unavailable, FRV has used data obtained from the TZV CAD system to provide the result. Using TZV CAD data instead of AIRS data means that the categorisation of type of event (i.e., structural fire or other) cannot be adjusted post-incident, where necessary, for accuracy.
Figure 6: 2.1.3a Percentage of response to structure fire incidents within 7.7 minutes (target 90 per cent)
2.3 Significant change from the previous quarter (positive or negative)
2.3.1 CFA: Decrease in stock loss due to fires (indicator 2.3.4)
CFA recorded a significant change for stock loss in Q3 and did not meet baseline this quarter.
CFA reported 146 for stock lost this quarter compared to nine the previous quarter (Figure 7). This is an increase of 137 for the quarter. CFA reports that this increase was driven by one significant grass and scrub fire that impacted 2,000 hectares of private property.
Figure 7: 2.3.4: A decrease in stock loss due to fires
2.3.2 FRV: Number of incidents other than structure fires and other non-fire related incidents within FRV districts: non-structure fires (measure 1.3.3)
FRV recorded a significant change in the number of non-structure fire incidents in FRV Districts.
FRV reported 2346 non-structure fire incidents this quarter compared to 1824 in Q2, which is an increase of 522 incidents (Figure 8). FRV report that this is consistent with seasonal variability. FRV note that these incidents are attributed to grass and scrub fires in regional areas as well as bin/dumpster fires and passenger vehicle fires in non-regional areas.
Data note
As AIRS is not available, FRV has used data obtained from TZV CAD to provide this result.
Figure 8: 1.3.3: Number of incidents other than structure fires and other non-fire related incidents within FRV districts: non-structure fires
3. Reader guide
Definitions
| Acronym | Title |
|---|---|
| AIRS | Australian Incident Reporting System |
| CAD | Computer Aided Dispatch |
| CFA | Country Fire Authority |
| EMR | Emergency Medical Response |
| FES | Fire Equipment Services |
| FRV | Fire Rescue Victoria |
| FRV Act | Fire Rescue Victoria Act 1958 |
| FSIM | Fire Services Implementation Monitor |
| FTE | Full Time Equivalent |
| FY | Financial Year |
| TZV | Triple Zero Victoria |
Reference to fire services agencies
References to the fire services in this document relate specifically to CFA and FRV. Where more than one fire services agency is referenced together in this document, they are listed in alphabetical order.
Comparison between agencies’ performance against published outcomes frameworks
Comparisons between the agencies should not be made as the outcomes frameworks necessarily vary based on the CFA and FRV’s respective strategic and operational priorities and data.
4. Appendix A: CFA Q3 2023-24 outcomes progress report
CFA outcomes framework
This is CFA’s Year Three outcomes framework progress report for Q3 2023-24. The CFA progress report includes quarterly year-on-year baselines, which is the average of five years of data (unless otherwise specified) and an annual baseline, which is a five-year average (unless otherwise specified).
5. Appendix B: FRV Q3 2023-24 outcomes progress report
FRV outcomes framework
In Q3 2023-24, FRV reported on 18 quarterly measures (against 12 indicators). Quarterly data impacted by the cyber-attack in December 2022 has not been included in the progress report for six indicators and ten measures. Annual data is not included in this report and as a result not all indicators and measures are numbered sequentially.