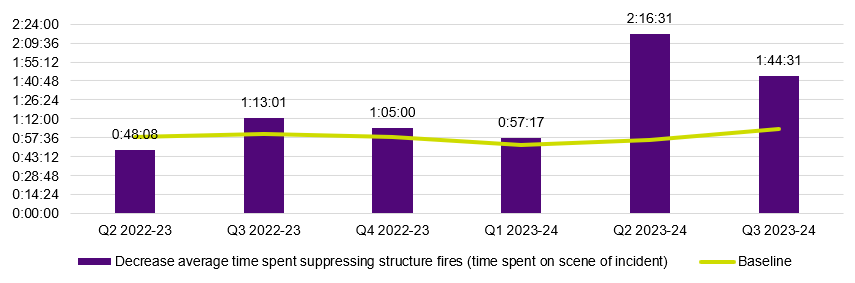
2.2.1 CFA: Decrease average time spent suppressing structure fires (time spent on scene of incident) (indicator 2.2.3)
CFA has not met the baseline for this indicator since Q2, 2022-23 (Figure 4).
CFA recorded a result of 104 minutes and 31 seconds this quarter. This is an increase of 40 minutes and 21 seconds on the quarterly baseline of 64 minutes and 10 seconds.
CFA advised there were several hayshed fires during the reporting period. Hayshed fires impact reporting data as they require a significant amount of time to extinguish.
Figure 4: 2.2.3 Decrease average time spent suppressing structure fires (time spent on scene of incident)

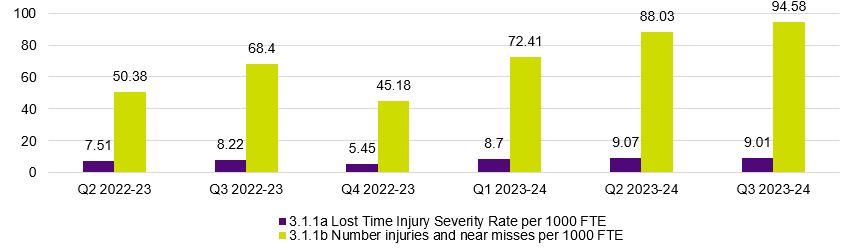
2.2.2 FRV: Increase in support and maintenance of firefighters’ physical and psychological health (indicator 3.1.1)
As identified in section 1.2 Maturing Outcomes Frameworks above, FRV has reduced the measures being reported against under the indicator 3.1.1. FRV now only report on the following two measures.
Measure ‘3.1.1a Lost time injury severity rate per 1000 FTE’, FRV recorded a result of 9.01 this quarter, representing a similar result to Q2 2023-24 (Figure 5).
Measure ‘3.1.1b: Number of injuries and near misses per 1000 FTE’, FRV recorded a result of 94.59 this quarter compared to 88.03 in Q2 2023-24 (Figure 5). This is the highest recorded result for this measure. FRV report that the increase of injuries from over Q1 and Q2 2023-24 are in part related to psychological exposure reports which are now classified as incidents/injuries rather than hazards.
Figure 5: 3.1.1: Increase in support and maintenance of firefighters’ physical and psychological health.

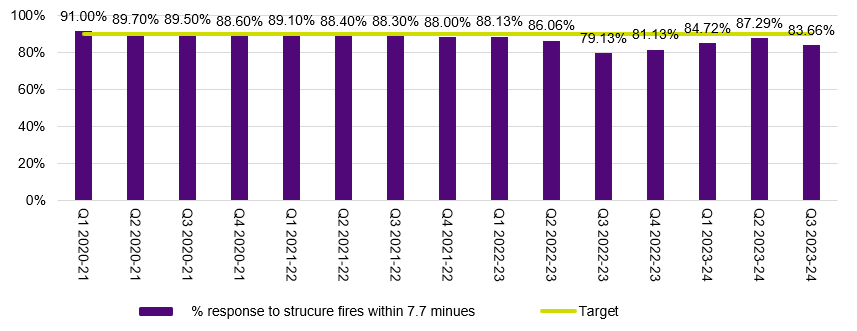
2.2.3 FRV: Percentage of response to structure fire incidents within 7.7 minutes (target 90 per cent) (measure 2.1.3a)
For the fourteenth consecutive quarter, FRV did not meet its target of 90 per cent. This quarter, FRV responded to 83.66 per cent of structure fire incidents within 7.7 minutes (FRV measure 2.1.3a) (Figure 6).
FRV report attending to a higher number of structure fire incidents in Q3 compared to the previous quarter. In Q3, FRV responded to 1113 structure fires incidents within FRV districts, an increase of 109 since Q2, and 211 structure fire incidents outside of FRV districts, an increase of 18 since Q2.
FRV report that with increased demand, and an increased number of responses to events outside FRV districts (see FRV measure 3.4.1), the level of operational availability (appliance at station, ready to respond) was reduced in certain areas requiring some crews to travel further to reach incidents where the local station is otherwise occupied.
Data note
As AIRS is unavailable, FRV has used data obtained from the TZV CAD system to provide the result. Using TZV CAD data instead of AIRS data means that the categorisation of type of event (i.e., structural fire or other) cannot be adjusted post-incident, where necessary, for accuracy.
Figure 6: 2.1.3a Percentage of response to structure fire incidents within 7.7 minutes (target 90 per cent)

Updated