- Date:
- 17 Nov 2025
The Country Fire Authority (CFA) and Fire Rescue Victoria (FRV) have provided their quarterly fire service performance updates for the quarter 4, 2024-25 reporting period (1 April 2025 to 30 June 2025) to the Fire Services Implementation Monitor (FSIM).
In this quarter:
- The CFA’s Outcomes Framework included 47 indicators (quarterly and annual) of which 44 were reported on.
- FRV’s Outcomes Framework included 51 measures (quarterly and annual) of which 50 were reported on.
The FSIM has reported on select results based on the following criteria:
Demonstrates a notable achievement
- CFA: Decrease in median time spent suppressing structure fires (time spent on scene of incident) (indicator 2.2.3).
- CFA: Increase in homes with operational smoke alarms (indicator 2.3.6).
- CFA: Increase in participation on CFA run inclusion and diversity networks and groups (indicator 3.2.5).
- FRV: Number of Fire Education (FireEd) and risk reduction programs delivered to the community (measure 1.1.2a).
- FRV: Percentage of response times to Emergency Medical Response (EMR) within 9.2 minutes (90%) (measure 2.1.3a).
Continuing off-track trend over repeated quarters
- FRV: Percentage of response to structure fire incidents within 7.7 minutes (target 90%) (measure 2.1.3a).
Significant change from the previous quarter (positive or negative)
- CFA: Decrease in workplace injuries (volunteer operational activity) (indicator 3.1.2) – the quarter 4 (Q4) result demonstrated a significant decrease against the quarter 3 (Q3) result for this indicator, which reflects a positive outcome. Note that for this indicator, the CFA deems a lower result as desirable.
- CFA: Increase delivery of operational training to CFA volunteers (indicator 3.4.7) – the Q4 result demonstrated a significant increase against the Q3 result for this indicator, which reflects a positive outcome. Note that for this indicator, the CFA deems a higher result as desirable.
- FRV: Lost time injury severity rate per 1,000 Full-Time-Equivalent (FTE) (measure 3.1.1a) – the Q4 result demonstrated a decrease against the Q3 result for this measure, which reflects a positive outcome.
The FSIM acknowledges the CFA and FRV for their ongoing cooperation and active contribution to the FSIM’s monitoring and reporting activities.
1. Summary
The Fire Services Outcomes Framework Progress Report is prepared and published in accordance with the Fire Services Implementation Monitor’s (FSIM) functions under section 141 of the Fire Rescue Victoria Act 1958 (Vic). It includes results and commentary from the FSIM on select results from the Country Fire Authority’s (CFA) and Fire Rescue Victoria’s (FRV) respective outcomes frameworks for the fourth quarter of the 2024–25 financial year.
The FSIM publishes these quarterly reports on its website at Fire Services Implementation Monitor publications.
In this quarter:
- CFA’s Outcomes Framework included 47 indicators (quarterly and annual) of which 44 were reported on (see Appendix A).
- FRV’s Outcomes Framework included 51 measures (quarterly and annual) of which 50 were reported on (see Appendix B).
CFA indicators and FRV measures short-listed for reporting
The FSIM has reported on select results based on the following criteria:
Demonstrates a notable achievement:
- CFA: Decrease in median time spent suppressing structure fires (time spent on scene of incident) (indicator 2.2.3).
- CFA: Increase in homes with operational smoke alarms (indicator 2.3.6).
- CFA: Increase in participation on CFA run inclusion and diversity networks and groups (indicator 3.2.5).
- FRV: Number of Fire Education (FireEd) and risk reduction programs delivered to the community (measure 1.1.2a).
- FRV: Percentage of response times to Emergency Medical Response (EMR) within 9.2 minutes (90%) (measure 2.1.3a).
Continuing off-track trend over repeated quarters:
- FRV: Percentage of response to structure fire incidents within 7.7 minutes (target 90%) (measure 2.1.3a).
Significant change from the previous quarter (positive or negative outcome):
- CFA: Decrease in workplace injuries (volunteer operational activity) (indicator 3.1.2) – the quarter 4 (Q4) result demonstrated a significant decrease against the quarter 3 (Q3) result for this indicator, which reflects a positive outcome. Note that for this indicator, CFA deems a lower result as desirable.
- CFA: Increase delivery of operational training to CFA volunteers (indicator 3.4.7) – the Q4 result demonstrated a significant increase against the Q3 result for this indicator, which reflects a positive outcome. Note that for this indicator, CFA deems a higher result as desirable.
- FRV: Lost time injury severity rate per 1,000 Full-Time-Equivalent (FTE) (measure 3.1.1a) – the Q4 result demonstrated a decrease against the Q3 result for this measure, which reflects a positive outcome.
2. Outcomes framework Q4 results
The Fire Services Implementation Monitor’s analysis of select results from Q4 2024–25 fire services performance measures.
2.1 Demonstrates a notable achievement
Summary of notable achievements recorded by the CFA and FRV this quarter.
2.2 Continuing off-track trend over repeated quarters
Summary of outcome indicators and measures that represent an off-track trend over repeated quarters.
2.3 Significant change from the previous quarter (positive or negative)
Summary of outcome indicators and measures that recorded a significant change in result from the previous quarter.
2.1 Demonstrates a notable achievement
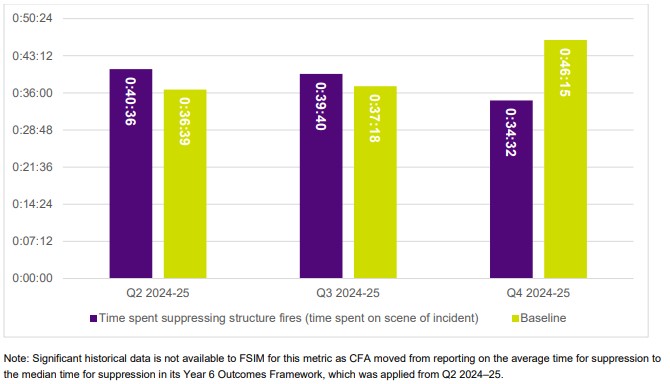
CFA: Decrease in median time spent suppressing structure fires (time spent on scene of incident)
CFA reported a median time of 34 minutes and 32 seconds spent suppressing structure fires during Q4.
The median time spent suppressing structure fires in Q4 was 11 minutes and 43 seconds less than the baseline of 46 minutes and 15 seconds, reflecting a 25.3% improvement on the baseline.
Figure 1: Decrease in median time spent suppressing structure fires (time spent on scene of incident)
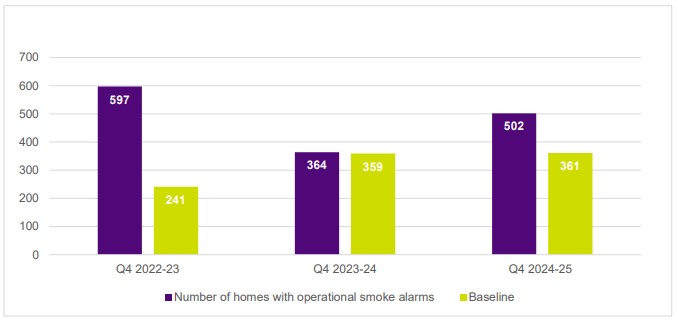
CFA: Increase in homes with operational smoke alarms
Q4 is generally the highest activity quarter for the CFA smoke alarm installation program. CFA reported 502 smoke alarms were installed by members this Q4, which is 39% above the quarterly baseline.
This service is primarily targeted towards individuals who are considered at higher risk to the effects of fire, because they are unable to purchase, install or maintain the device independently. Higher risk groups include the elderly or people on low incomes.
Figure 2: Increase in homes with operational smoke alarms
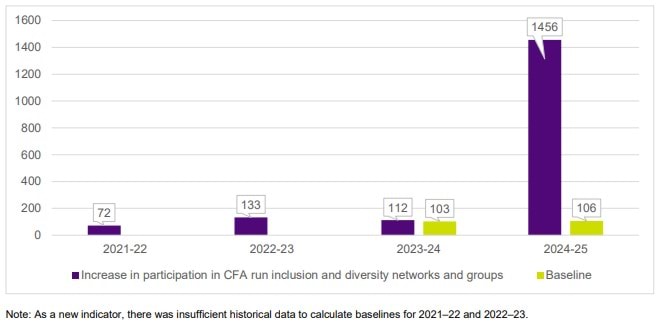
CFA: Increase in participation in CFA run inclusion and diversity networks and groups
CFA reported a significant increase in the result for this annual indicator, of 1456 members participating in CFA run inclusion and diversity networks and groups. This is the result of a range of CFA-led and facilitated groups, including the Friends of Koori Inclusion Action Plan1 group, the Culturally Inclusive Personal Protective Equipment project, and the Women’s Challenges Camps.
1 The CFA’s Koori Inclusion Action Plan was the agency’s first (2014–19) Aboriginal inclusion plan
Figure 3: Increase in participation in CFA run inclusion and diversity networks and groups

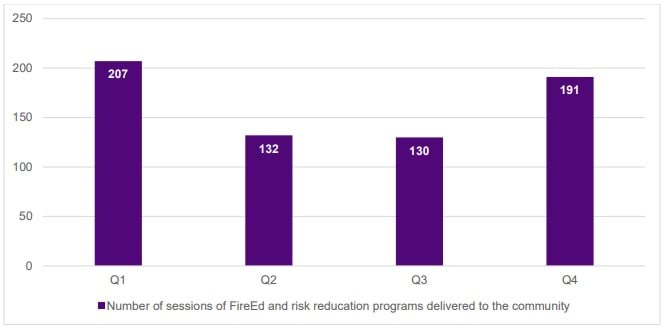
FRV: Number of sessions of FireEd and risk reduction programs delivered to the community
FRV reported a Q4 result of 191 sessions of FireEd and risk reduction programs delivered to the community, which is an increase of 61 sessions or 46.9% on the Q3 result of 130 sessions.
FRV advised that program delivery is consistently higher in Q1 and Q4 when stakeholders, including FRV educators and session participants, have increased availability. Primary schools comprise a significant proportion of the FireEd and risk reduction audience. The school summer holiday period aligns with peak fire season, which explains the high uptake of FireEd by primary school children in Q1 and Q4.
The FSIM notes that the annual number of FireEd and risk reduction programs sessions delivered in the 2024–25 financial year (660) was slightly lower than the 2023–24 financial year (718). FRV attributed this decrease to transitioning to a new reporting system.
Figure 4: Number of sessions of FireEd and risk reduction programs delivered to the community

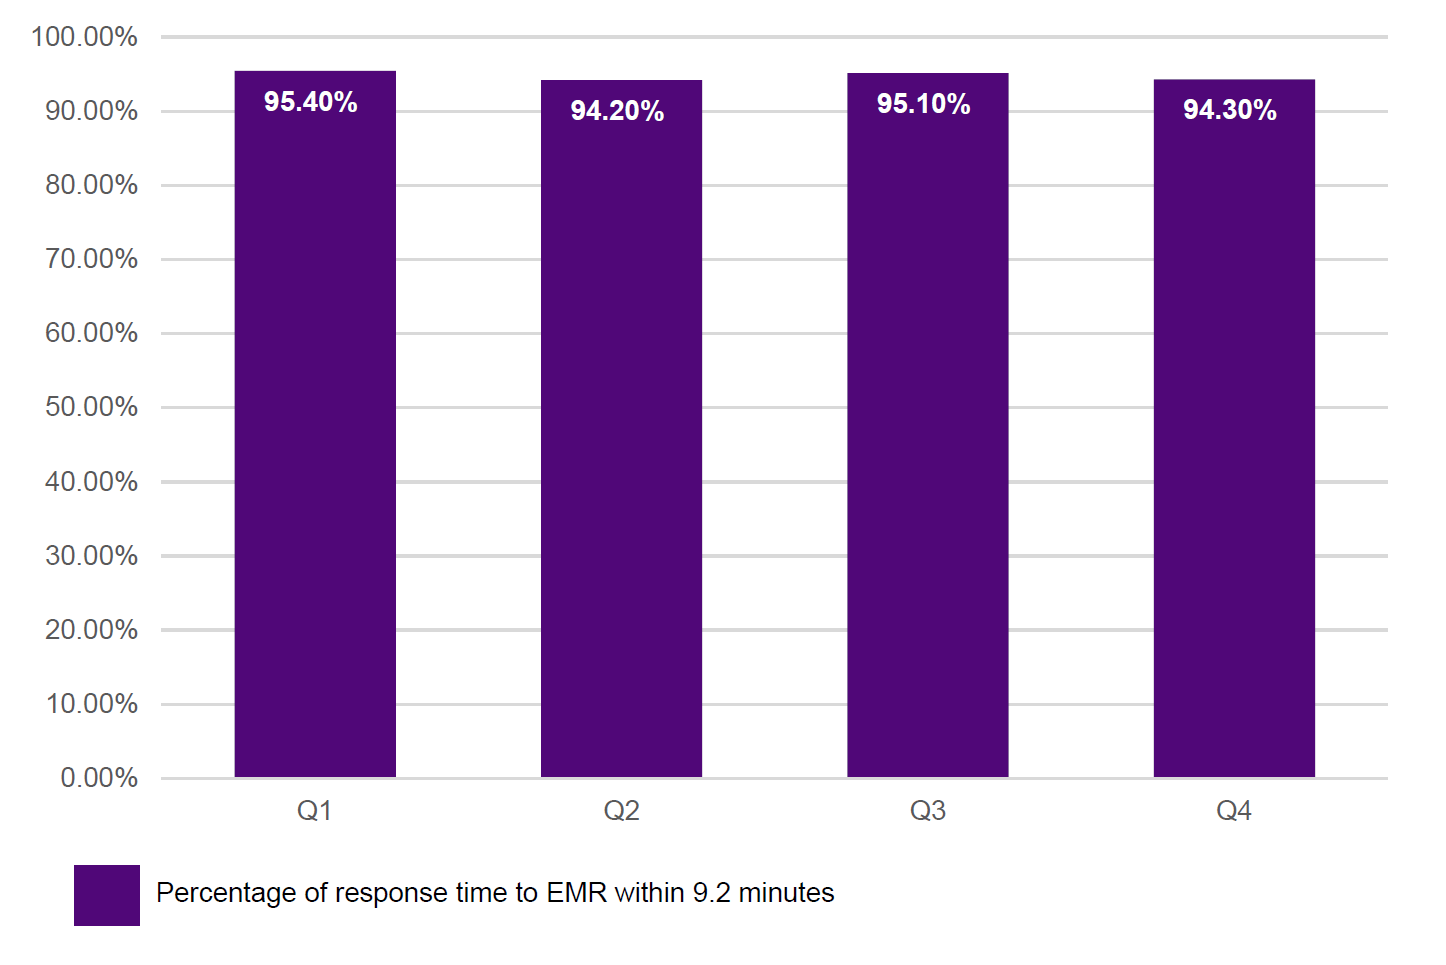
FRV: Percentage of response time to EMR within 9.2 minutes
FRV reported a 94.3% response time to EMR within 9.2 minutes for Q4. FRV has consistently exceeded the target of 90%.
Figure 5: Percentage of response time to EMR within 9.2 minutes

2.2 Continuing off-track trend over repeated quarters
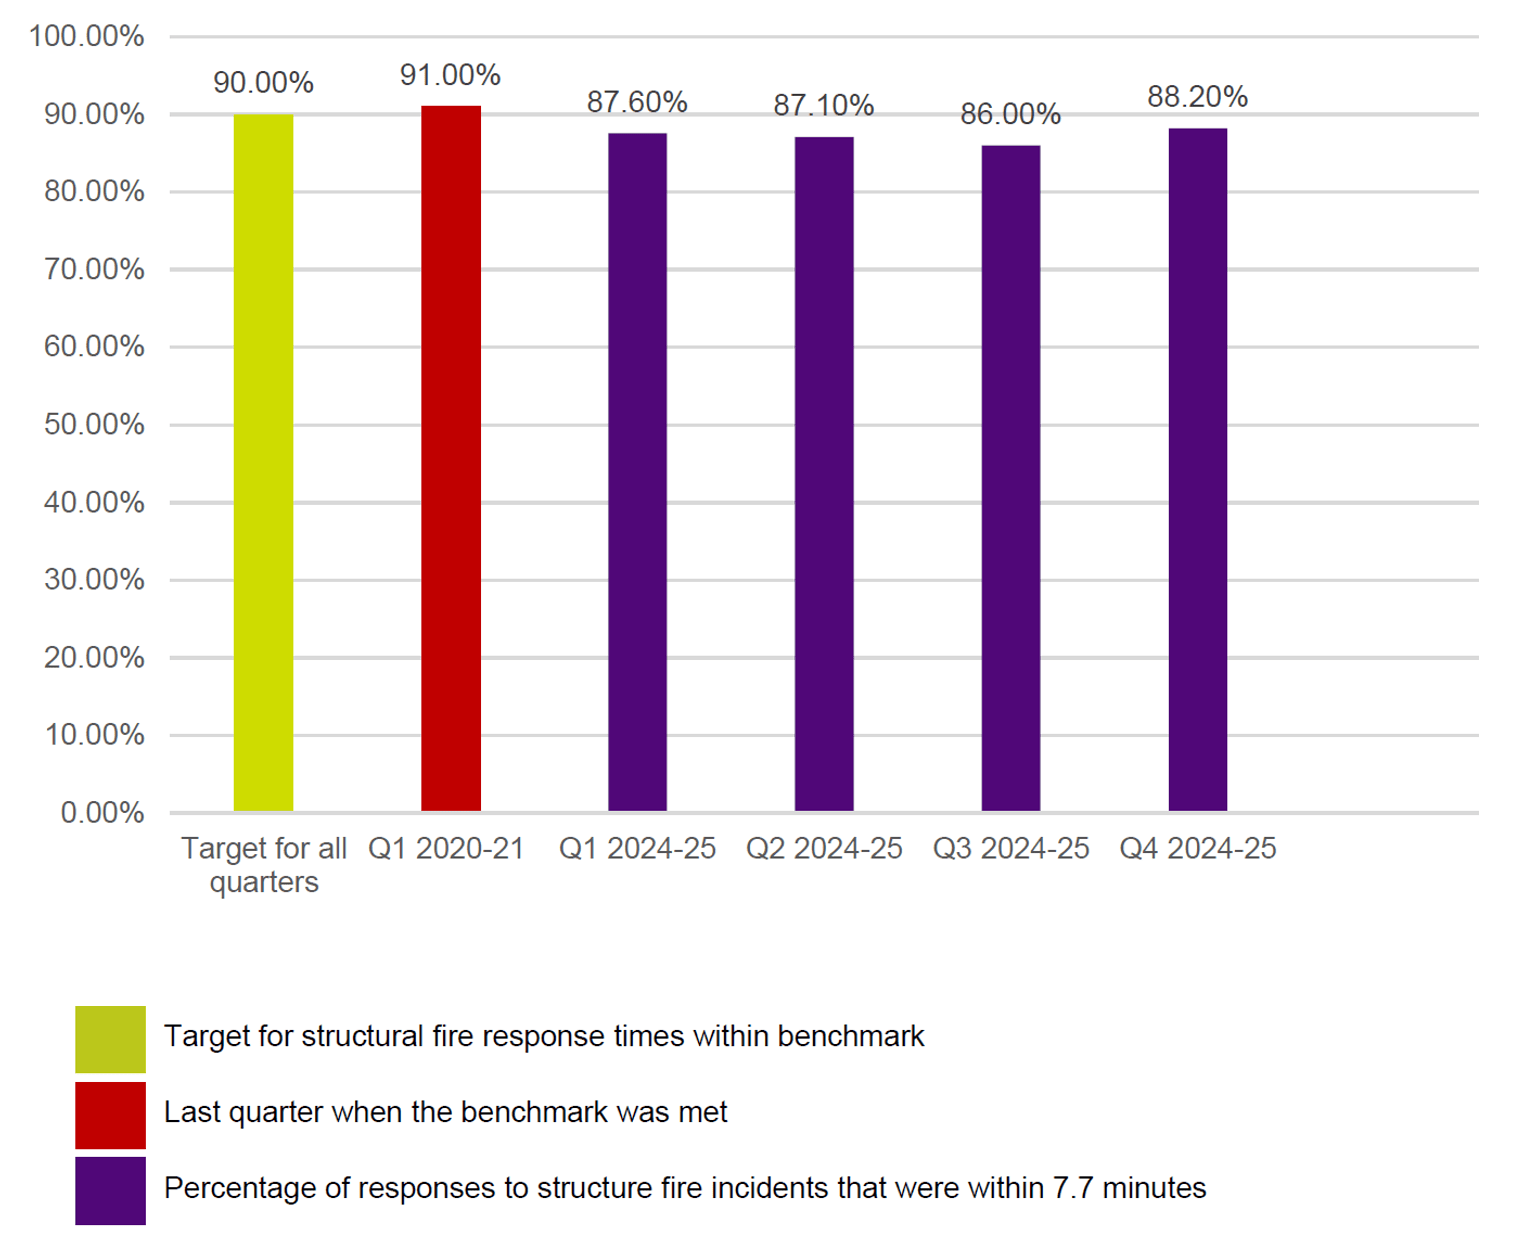
FRV: Percentage of response to structure fire incidents within 7.7 minutes (target 90%)
FRV’s result for this measure in Q4 in 2024–25 represents the 19th consecutive quarter where the target of 90% has not been met. Q1 of 2020–21 was the last quarter when this target was achieved (indicated in red in Figure 6). The Q4 result of 88.2% was a 2.5% increase on the Q3 result of 86.2%.
Figure 6: Percentage of response to structure fire incidents within 7.7 minutes
2.3 Significant change from the previous quarter (positive or negative)
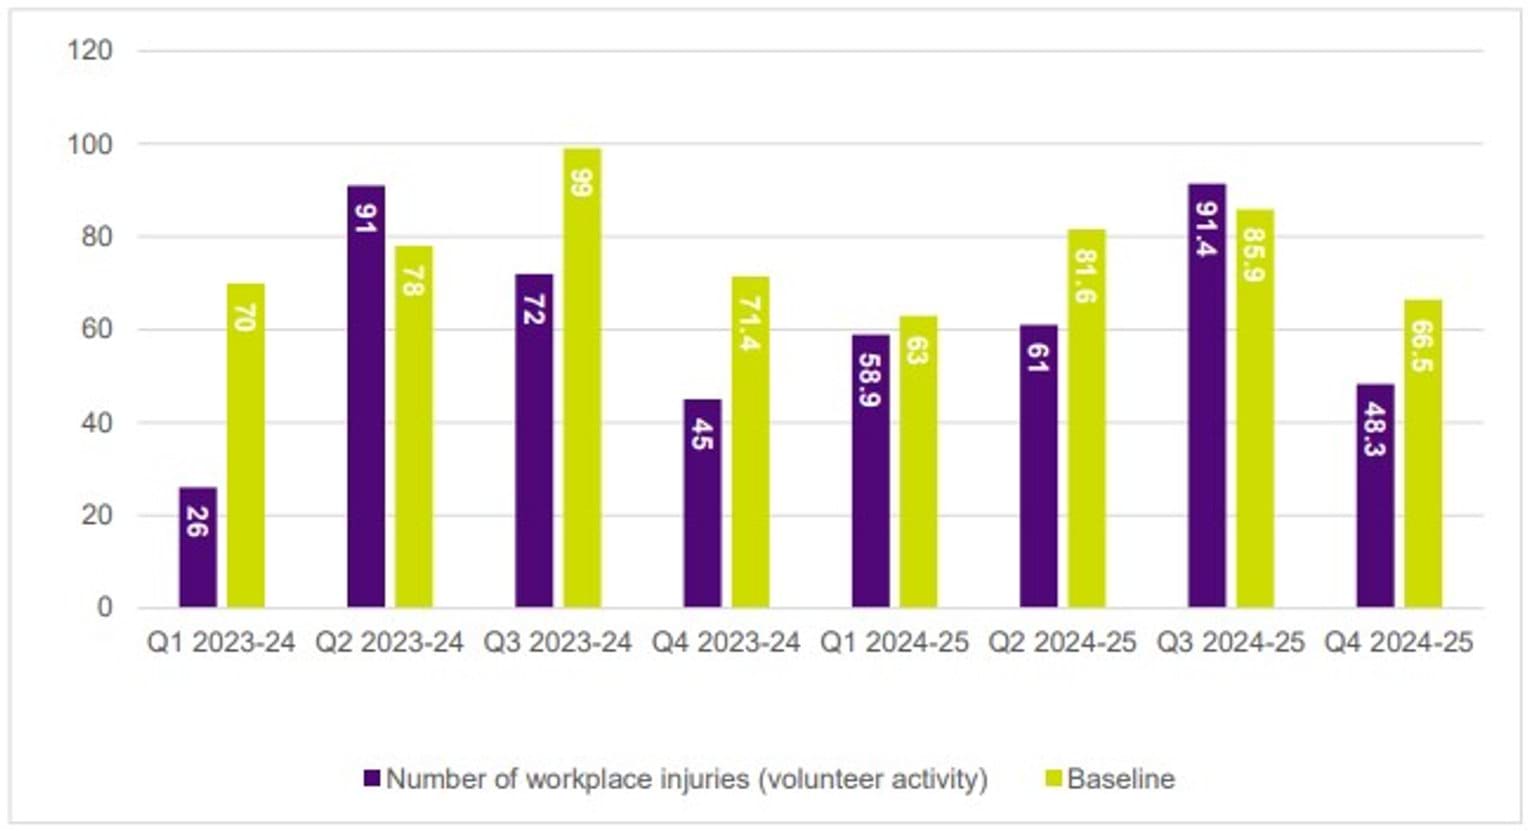
CFA: Decrease in workplace injuries (volunteer operational activity)
CFA reported a 27.4% improvement on the baseline for Q4 for this indicator, which is a significant change on Q3, where CFA reported a result 6.4% below the baseline.
CFA indicated that while this is a positive result, no definitive trend has been established. The number of workplace injuries can be influenced by the level of operational activity, which is typically less during the winter months.
Figure 7: A decrease in workplace injuries (volunteer operational activity)
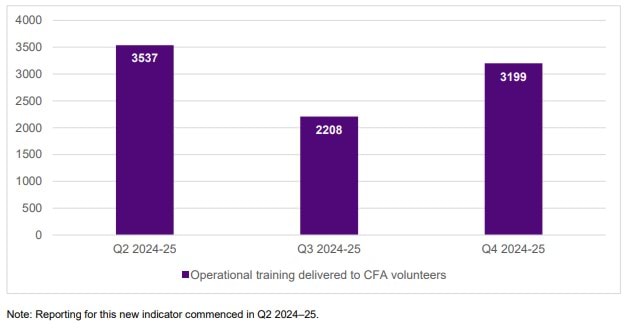
CFA: Increase in delivery of operational training to CFA volunteers
In Q4 2024–25, CFA reported that 3,199 certificates were provided to CFA volunteers who completed operational training activities. This is an increase of 44.8% from Q3, when 2,208 certificates were provided for operational training.
Q4 is a non-peak period for fire activity, which increases the availability of volunteers and trainers to participate in the structured training across Victoria. Other factors that contributed to this result were expanded course availability and improvements in systems and processes for recording and reporting course completion.
Figure 8: Delivery of operational training to CFA volunteers

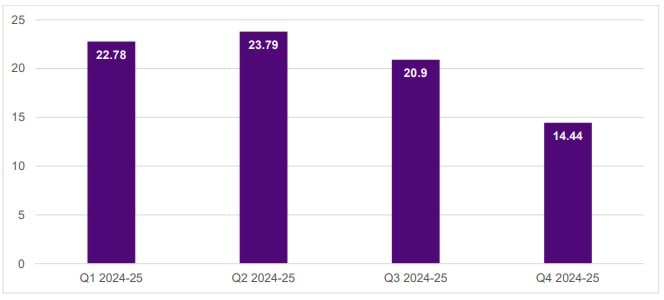
FRV: Lost time injury severity rate per 1,000 FTE
FRV reported a decline in the time lost to injury in Q4 2024–25, which is the third consecutive quarter this trend has been reported. The Q4 result of 14.44 per 1,000 FTE of one or more working days/shifts lost, is an improvement of 30.9% on the Q3 result of 20.9. FRV advised a clear causal factor behind this trend has not been identified.
Figure 9: FRV: Lost time injury severity rate per 1,000 FTE

3. Reader guide
Definitions
| Acronym | Title |
| CFA | Country Fire Authority |
| EMR | Emergency Medical Response |
| FireEd | Fire Education |
| FRV | Fire Rescue Victoria |
| FSIM | Fire Services Implementation Monitor |
| FTE | Full-Time-Equivalent |
4. Appendix A: CFA’s Q4 2024-25 outcomes progress report
CFA outcomes framework
This is CFA’s outcomes progress report for Q4 2024–25. This progress report includes results against the CFA’s quarterly and annual outcome metrics.
5. Appendix B: FRV’s Q4 2024-25 outcomes progress report
FRV outcomes framework
This is FRV’s outcomes progress report for Q4 2024–25. This progress report includes results against FRV’s quarterly and annual outcome metrics.