CFA: Decrease in median time spent suppressing structure fires (time spent on scene of incident)
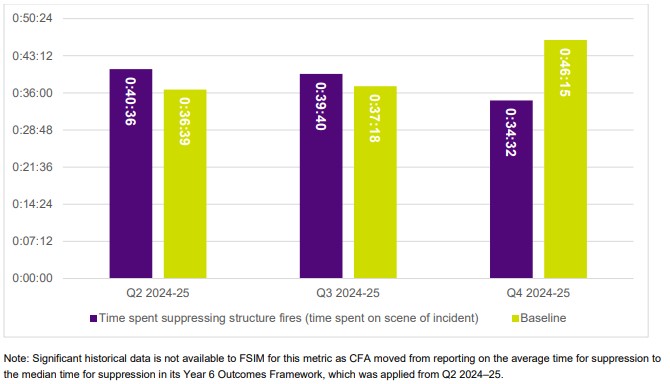
CFA reported a median time of 34 minutes and 32 seconds spent suppressing structure fires during Q4.
The median time spent suppressing structure fires in Q4 was 11 minutes and 43 seconds less than the baseline of 46 minutes and 15 seconds, reflecting a 25.3% improvement on the baseline.
Figure 1: Decrease in median time spent suppressing structure fires (time spent on scene of incident)
CFA: Increase in homes with operational smoke alarms
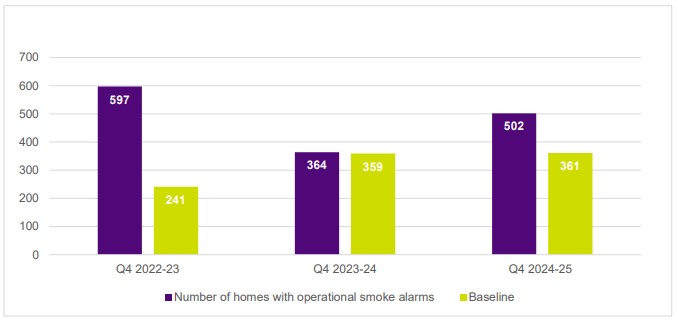
Q4 is generally the highest activity quarter for the CFA smoke alarm installation program. CFA reported 502 smoke alarms were installed by members this Q4, which is 39% above the quarterly baseline.
This service is primarily targeted towards individuals who are considered at higher risk to the effects of fire, because they are unable to purchase, install or maintain the device independently. Higher risk groups include the elderly or people on low incomes.
Figure 2: Increase in homes with operational smoke alarms
CFA: Increase in participation in CFA run inclusion and diversity networks and groups
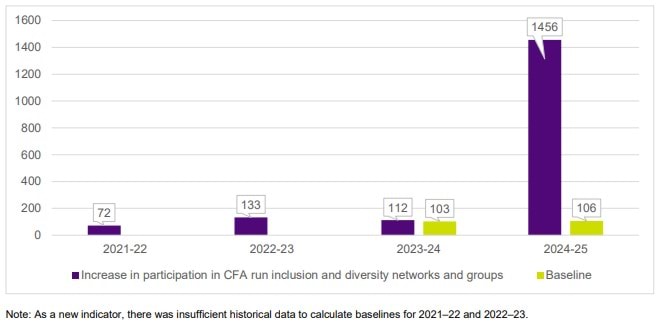
CFA reported a significant increase in the result for this annual indicator, of 1456 members participating in CFA run inclusion and diversity networks and groups. This is the result of a range of CFA-led and facilitated groups, including the Friends of Koori Inclusion Action Plan1 group, the Culturally Inclusive Personal Protective Equipment project, and the Women’s Challenges Camps.
1 The CFA’s Koori Inclusion Action Plan was the agency’s first (2014–19) Aboriginal inclusion plan
Figure 3: Increase in participation in CFA run inclusion and diversity networks and groups

FRV: Number of sessions of FireEd and risk reduction programs delivered to the community
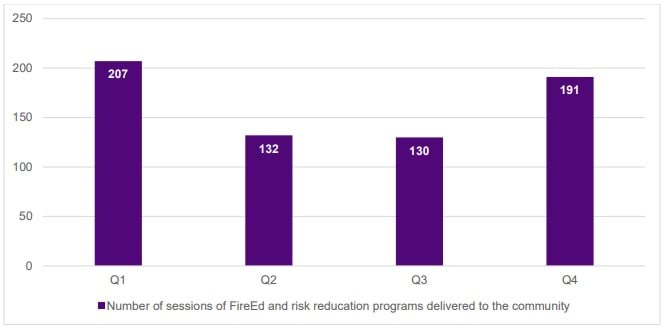
FRV reported a Q4 result of 191 sessions of FireEd and risk reduction programs delivered to the community, which is an increase of 61 sessions or 46.9% on the Q3 result of 130 sessions.
FRV advised that program delivery is consistently higher in Q1 and Q4 when stakeholders, including FRV educators and session participants, have increased availability. Primary schools comprise a significant proportion of the FireEd and risk reduction audience. The school summer holiday period aligns with peak fire season, which explains the high uptake of FireEd by primary school children in Q1 and Q4.
The FSIM notes that the annual number of FireEd and risk reduction programs sessions delivered in the 2024–25 financial year (660) was slightly lower than the 2023–24 financial year (718). FRV attributed this decrease to transitioning to a new reporting system.
Figure 4: Number of sessions of FireEd and risk reduction programs delivered to the community

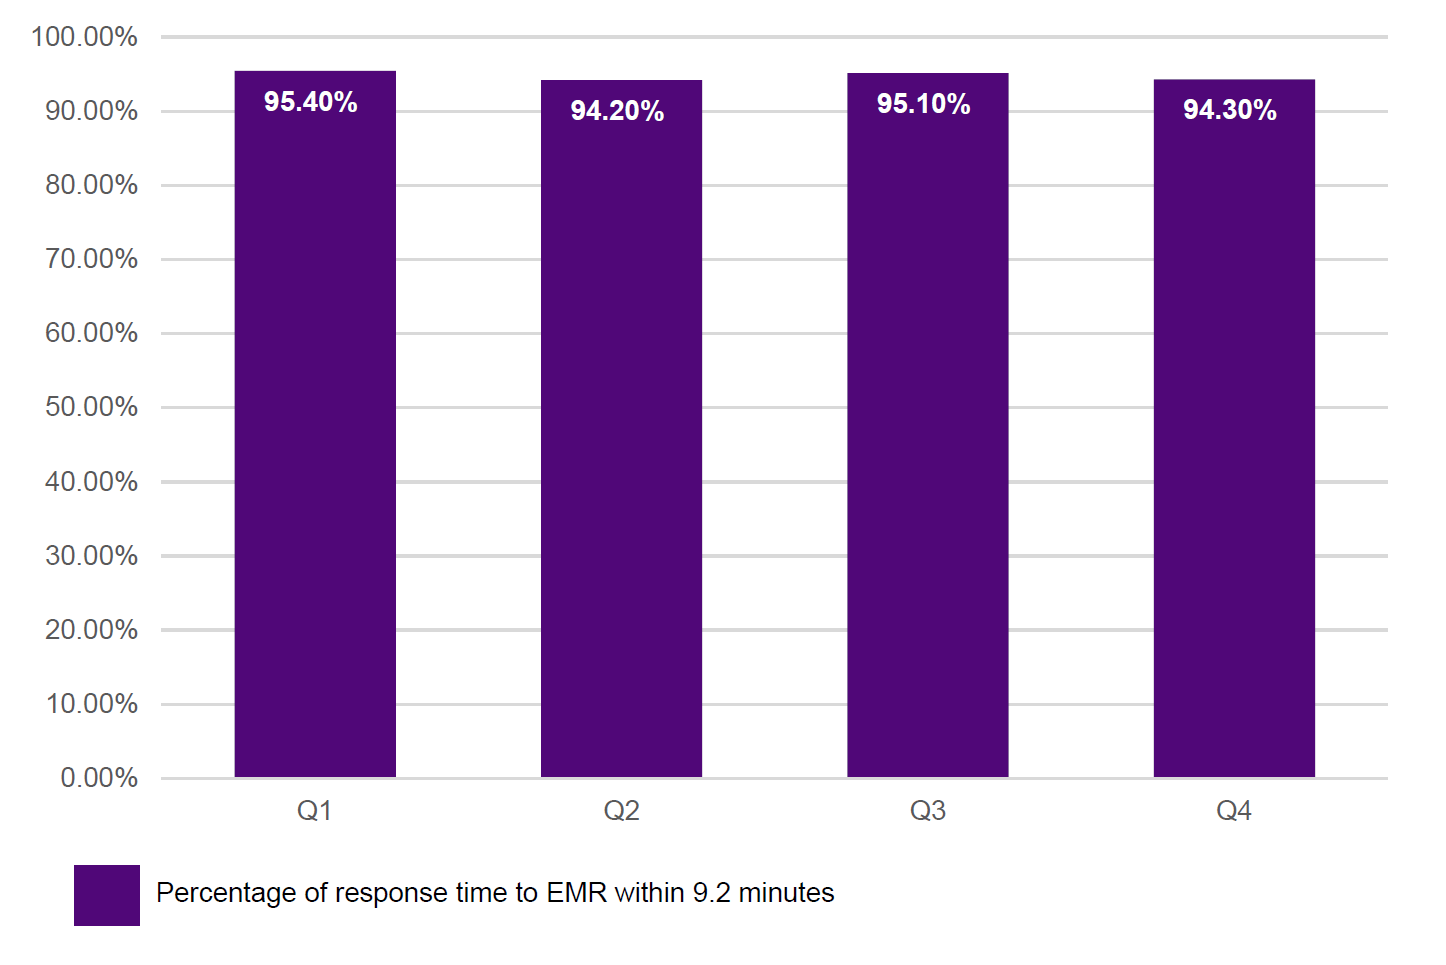
FRV: Percentage of response time to EMR within 9.2 minutes
FRV reported a 94.3% response time to EMR within 9.2 minutes for Q4. FRV has consistently exceeded the target of 90%.
Figure 5: Percentage of response time to EMR within 9.2 minutes

Updated