Financial management compliance
Attestation for compliance with Ministerial Standing Direction 5.1.4
Department of Premier and Cabinet
I, Jeremi Moule, the Secretary of the Department of Premier and Cabinet, certify that the Department of Premier and Cabinet has no Material Compliance Deficiency with respect to the applicable Standing Directions under the Financial Management Act 1994 and Instructions.
Jeremi Moule
Secretary
Department of Premier and Cabinet
Melbourne
13 September 2023
Wage Inspectorate Victoria
I, Robert Hortle, the Commissioner of the Wage Inspectorate Victoria, certify that the Wage Inspectorate Victoria has no Material Compliance Deficiency with respect to the applicable Standing Directions under the Financial Management Act 1994 and Instructions.
Robert Hortle
Commissioner
Wage Inspectorate Victoria
Melbourne
21 July 2023
Financial performance
Significant factors that affected DPC’s performance in 2022–23 are summarised below.
DPC recorded a net profit result from operations of $2.1 million for 2022–23.
The profit result is primarily due to timing of trust funds operation, where funds received during 2022–23 will be expended in future years.
Sources of income ($ million)
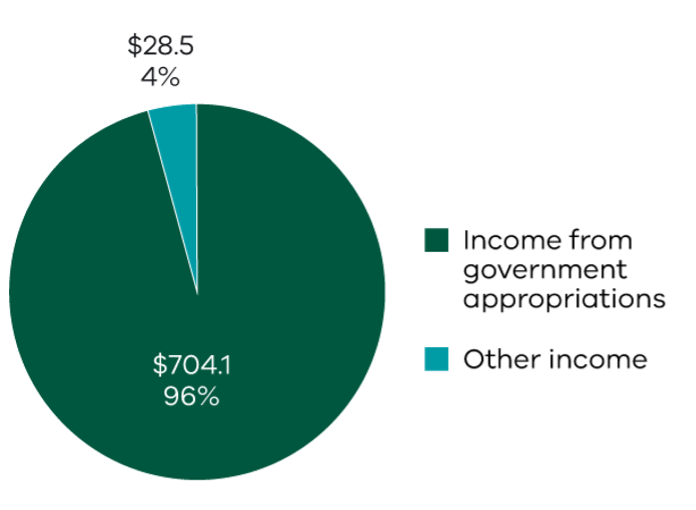
The above graph shows the sources of income available to DPC during the 2022–23 financial year.
DPC’s main source of income is from government appropriations, which account for 96 per cent of income. The balance is derived from government grants and services.
Compared with 2021–22 the overall increase in DPC’s income is mainly due to an increase associated with 2022 State Election funding. This resulted in higher government appropriations.
Expenses ($ million)
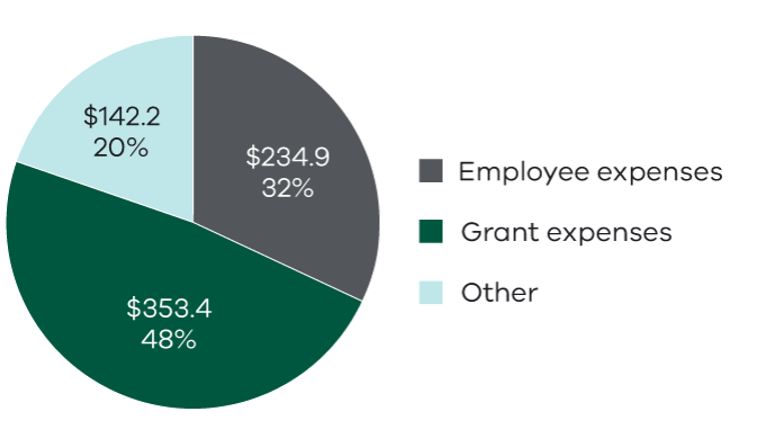
The above graph shows the distribution of expenses in delivering DPC’s services.
DPC’s total expenses have increased by $55.4 million compared with 2021–22. This is mainly due to increased expenditure for the 2022 State Election and increased grant payments towards the Self-Determination Fund and Breakthrough Victoria.
Financial position — balance sheet
DPC’s assets and liabilities have decreased due to the transfer of functions from DPC following machinery of government changes effective from 1 January 2023.
Cash flows
DPC had a net cash inflow from operating activities of $17.1 million. Compared with last year, this is a $12.6 million decrease. This decrease is mainly due to an overall decrease in level of operational activity due the transfer of major functions following the machinery of government changes, including the timing of payment of liabilities.
Direct costs attributable to machinery of government changes
There were no direct costs attributable to the machinery of government change that have been incurred by the entities that are consolidated into DPC’s annual report pursuant to section 53(1)(b) of the Financial Management Act 1994.
Subsequent events
Refer to the section on subsequent events at Note 8.10 in DPC’s financial statements.
Capital projects / asset investment
During 2022–23 DPC did not have any completed projects that met the disclosure threshold of $10 million or greater.
Details of government advertising expenditure in 2022–23
(Campaigns with a media spend of $100,000 or greater) ($ thousand) Name of campaign Campaign summary Start/end date Advertising (media) expenditure (excl. GST) Creative and campaign development expenditure (excl. GST) Research and evaluation expenditure (excl. GST) Print and collateral expenditure (excl. GST) Other campaign expenditure (excl. GST) Total COVID-19 Winter 2022 campaign Campaign encouraging Victorians to adopt behaviours to protect themselves and more vulnerable members of the community from infectious disease over winter. 20 July – 4 September 2022 1,285 133 0 0 0 1,418 Building Equality An awareness campaign to promote the government’s Building Equality Policy. 26 September –26 October 2022 186 0 0 0 0 186(1) Gig Worker Support Service Awareness campaign to promote the launch of the Gig Worker Support Service, which provides information and advice to gig workers, as well as referrals to other services to resolve disputes. 18 May –
30 June 2023348 125 0 0 0 473 Note:
(1) Creative and campaign development costs were incurred in the 2021–22 financial year.
For the 2022–23 reporting period, DPC had a total information and communications technology (ICT) expenditure of $35.3 million, with details shown below.
Expenditure
($ thousand)
All operational ICT expenditure Business as usual (BAU) ICT expenditure (total) 20,942 ICT expenditure related to projects to create or enhance ICT capabilities Operational expenditure 4,364 Capital expenditure 10,014 Non-BAU ICT expenditure (total) 14,378 ICT expenditure refers to DPC’s costs in providing business-enabling ICT services. It comprises BAU ICT expenditure and non-BAU ICT expenditure:
- Non-BAU ICT expenditure relates to extending or enhancing DPC’s current ICT capabilities.
- BAU ICT expenditure is all remaining ICT expenditure, which primarily relates to ongoing activities to operate and maintain the current ICT capability.
Consultancy expenditure
Details of consultancies (valued at $10,000 or greater)
In 2022–23 there were 21 consultancies engaged with a total approved value at $10,000 or greater. The total expenditure incurred during 2022–23 in relation to these consultancies was $4.1 million (excluding GST).
Consultant Purpose of consultancy Total approved project fee $
(excl. GST)Expenditure 2022–23 $
(excl. GST)Future expenditure $
(excl. GST)ACIL Allen Consulting Pty Ltd Lapsing program evaluation of the Premier’s Jobs and Investment Fund 69,393 69,393 – Arup Pty Ltd Municipal and Essential Services Infrastructure Reviews for the Framlingham and Lake Tyers Aboriginal Trusts 138,773 83,624 55,149 Bree Gorman Consulting Development of an LGBTIQA+ Plan for DPC 29,091 5,818 23,273 Brooke Institute Pty Ltd Gather requirements and design the Technology Roadmap for the Emergency Management Sector 453,750 55,218 – Cathy Whelan Change management consulting services for the First Peoples – State Relations group 56,000 31,500 24,500 CyberCX Co-Design the Water Sector Strategic Security Plan 54,300 54,300 – Deloitte Touche Tohmatsu Reg-Tech Roadmap and Implementation Plan 629,286 299,741 – Deloitte Touche Tohmatsu Professional services to support the base and efficiency reviews 152,219 152,219 – First Point Consulting Lapsing program evaluation for Grants and Awards 30,800 30,800 – Korn Ferry (AU) Pty Ltd Analysis of remuneration for relevant public sector executor roles 84,955 42,478 – KPMG Independent review of Cenitex 801,364 80,000 – Melbourne Institute, Applied Economic & Social Research, University of Melbourne Social Services Workforce Modelling Projections 89,000 89,000 – Nous Group Pty Ltd Independent review of the Services Victoria Act 226,364 90,545 – Nous Group Pty Ltd Professional services to support the base and efficiency reviews 1,000,000 1,000,000 – Nous Group Pty Ltd Victoria Police Staff Allocation Model Evaluation 245,800 245,800 – Pricewaterhouse-Coopers Consulting (Australia) Pty Ltd Lapsing program evaluation for Single Digital Presence 176,526 176,526 – Pricewaterhouse-Coopers Consulting (Australia) Pty Ltd Risk services for Digital Victoria 52,282 52,282 – Pricewaterhouse-Coopers Indigenous Consulting Pty Ltd Evaluation of the Aboriginal Cultural Heritage Management Training Program 2014–2022 45,688 45,688 – Pricewaterhouse-Coopers Consulting (Australia) Pty Ltd Mentally Healthy Workplaces Framework and Tools 597,372 387,923 209,449 Security Master Australia Pty Ltd Strategic review of security arrangements for ministers and Members of Parliament 118,109 118,109 – The Boston Consulting Group Professional services to support organisational transition 990,000 990,000 – Total 6,041,071 4,100,963 312,371 Details of consultancies under $10,000
In 2022–23 there were three consultancies engaged with a total approved value of less than $10,000. The total expenditure incurred during 2022–23 in relation to these consultancies was $10,185 (excluding GST).
Major contracts
DPC is required to disclose, in accordance with the requirements of government policy and accompanying guidelines, all contracts greater than $10 million entered into during the financial year.
DPC did not enter into any new contracts greater than $10 million during 2022–23.
DPC has provided assistance through grants and transfer payments in 2022–23 as follows:
Economic policy advice and support
Securing Victoria’s international interests
Australia-India Institute Funding Agreement 2022–2023
Grant to build knowledge, understanding and connections between Victoria and India and supports Victoria to achieve the objectives of Victoria’s India Strategy.
Organisation Payment $ The University of Melbourne 478,500
Asia Society Funding Agreement 2022–2023
Grant to position Victoria as Australia’s business and cultural gateway to Asia and further Victoria’s ambitions of enhanced engagement with Asia.
Organisation Payment $ Asia Society Australasia Centre 330,000
Industrial relations
Building Equality Policy
Stakeholder consultation and research
Grant to create training and employment opportunities for women through government procurement on building, infrastructure, civil engineering and other capital works projects.
Organisation Payment $ Royal Melbourne Institute of Technology 128,913
Women in construction 2020–24
Grants to support the implementation of the Women in Construction Strategy 2020–24. The strategy seeks to increase the number of women undertaking a trade or semi-skilled roles in the construction industry.
Building Equality and Respect summit
Organisation Payment $ The Collective Lab 48,400
Building equality job support and employer engagement service
Organisation Payment $ The Trustee for the Redundancy Payment Central Fund 309,925
Building Futures website
Organisation Payment $ The Trustee for the Redundancy Payment Central Fund 38,940
Building equality employer of excellence platform
Organisation Payment $ Blue Glass House Pty Ltd 105,050
Inclusive leadership training
Grant to deliver training to the building and construction industry
Organisation Payment $ The Master Builders Association of Victoria 6,600
Construction industry safety training
Grants to employer and employee organisations to support occupational health and safety training in the construction industry.
Construction industry safety training 2020–23
Organisation Payment $ The Trustee for the Redundancy Payment Central Fund 1,100,000
Construction industry safety training 2018–22
Organisation Payment $ Incolink Foundation Limited 550,000
Self-determination policy and reform advice and programs
Aboriginal community strengthening program
Community Support Fund
Victorian NAIDOC Week events — grant to support the Victorian NAIDOC Committee to deliver NAIDOC Week events.
Organisation Payment $ Victorian Aboriginal Community Controlled Health Organisation Inc. 99,000
Reconciliation Victoria
To support local reconciliation activities. Promotes dialogue on reconciliation across the Victorian community, supporting local reconciliation groups and a calendar of events during Reconciliation Week.
Organisation Payment $ Reconciliation Victoria Inc. 341,000
Aboriginal Cultural Heritage Fund
Aboriginal Cultural Heritage Fund 2021–22
Grant for the Eastern Maar Aboriginal Corporation to prepare a cultural heritage management plan for the Kooyang Ceremonial Ground, located at Lake Bolac in southwest Victoria. The findings of the plan will inform a proposal for an ongoing protection declaration.
Organisation Payment $ Wurundjeri Woi Wurrung Cultural Heritage Aboriginal Corporation 44,000
Aboriginal land trusts
Municipal and Essential Services Funding 2014–24
Grants for the continued delivery of funding to the Lake Tyers and Framlingham Aboriginal Trusts to enhance the health, safety and wellbeing of the Lake Tyers and Framlingham Aboriginal communities.
Organisation Payment $ East Gippsland Shire Council 150,000
The Trustee for Framlingham Aboriginal Trust 1,212,085
The Trustee for the Lake Tyers Aboriginal Trust 891,000
Strengthening the independence of Framlingham and Lake Tyers Aboriginal Trusts
Grants for governance and wellbeing funding at Framlingham and Lake Tyers Aboriginal trusts.
Organisation Payment $ The Trustee for Framlingham Aboriginal Trust 143,919
The Trustee for the Lake Tyers Aboriginal Trust 143,919
Aboriginal Victoria Community Support Fund
Community Support Fund — Aboriginal Advancement League
Grant to the Aboriginal Advancement League for administrative support and to deliver stage two of facilities upgrades.
Organisation Payment $ Aborigines Advancement League Inc. 99,000
Closing the Gap partnership forum
Funding Round 1
Grant for the secretariat and sectoral engagement for the Partnership Forum on Closing the Gap, Victoria's formal implementation partner for the National Agreement on Closing the Gap.
Organisation Payment $ Aboriginal Housing Victoria 77,000
Federation of Victorian Traditional Owner Corporations Ltd 154,000
Rumbalara Aboriginal
Co-Operative Limited77,000
Victorian Aboriginal Child Care Agency Co Op Ltd 77,000
Empowering Victorian Aboriginal communities through infrastructure and organisational sustainability
Koorie Youth Council 2020–25
Grants to support the Koorie Youth Council to represent Aboriginal and Torres Strait Islander young people in Victoria and deliver key programs and events such as the Koorie Youth Summit.
Organisation Payment $ Youth Affairs Council of Victoria Inc. 503,736
South East Australian Aboriginal Justice Services Limited 174,964
Koorie Heritage Trust 2020–25
Grant to support programs and services that ensure the cultural heritage, history and knowledge systems of First Peoples are valued and celebrated.
Organisation Payment $ Koorie Heritage Trust Inc. 702,900
First Mortgage and Community Infrastructure Program
Urgent repairs and maintenance 2019–20
Grant to enable eligible First Peoples organisations to complete urgent repairs and maintenance of properties. Organisations eligible for this funding are those that the Minister for Treaty and First Peoples holds a first mortgage for. The funding prepares organisations for the first mortgage to be removed.
Organisation Payment $ Melbourne Aboriginal Youth Sport and Recreation (Maysar)
Co-Operative Ltd5,500
First Peoples’ Assembly of Victoria
Project specific funding to First Peoples’ Assembly of Victoria
Grant to First Peoples’ Assembly of Victoria to perform its functions as the Aboriginal representative body under the Advancing the Treaty Process with Aboriginal Victorians Act 2018.
Organisation Payment $ First Peoples’ Assembly of Victoria Ltd 11,497,000
Healing the Stolen Generations 2020–24
Connecting Home Limited 2020–24
Grant to support the delivery of case management, counselling, healing and other support programs and services for members of the Stolen Generations and their families.
Organisation Payment $ Connecting Home Ltd 1,375,000
Living Culture Grants Program
Living Culture Grants Program
Grant to support Victorians to protect, manage and celebrate Victorian Aboriginal cultural heritage.
Organisation Payment $ Barengi Gadjin Land Council Aboriginal Corporation RNTBC 27,058
The Dja Wurrung Clans Aboriginal Corporation 5,000
Munarra Centre for Regional Excellence
2018–19 Munarra Centre for Regional Excellence
To support education and employment opportunities for Aboriginal people in the Shepparton area.
Organisation Payment $ Greater Shepparton City Council 763,787
Munarra Limited 294,950
The Rumbalara Football Netball Club Inc. 11,000
Ricci Marks Awards
2023 Ricci Marks Awards
Grant to recognise the individual achievements and aspirations of young
(16–25) Aboriginal and Torres Strait Islander people in training, education, arts, sports, culture and community leadership.Organisation Payment $ E Brown 1,500
I Muller 1,500
J Couzens 5,000
Y Egan 5,000
Self-determination and sector capacity
Victorian Aboriginal Corporation for Languages’ key initiatives
Grant to support the work of member organisations of the Partnership Forum on Closing the Gap.
Organisation Payment $ Victorian Aboriginal Corporation for Languages 44,000
Treaty negotiations and strategy,
self-determinationOrganisation Payment $ Trustee of the Self-Determination Fund 35,000,000
Traditional Owner engagement and cultural heritage management programs
Aboriginal Cultural Heritage Management Training Program
Aboriginal Cultural Heritage Management Training Program 2020–23
Grants for the management and delivery of the Certificate IV in Aboriginal Cultural Heritage Management training to support the Victorian NAIDOC Committee to deliver NAIDOC Week events.
Organisation Payment $ La Trobe University 617,117
Aboriginal Heritage Officer Program
Aboriginal Heritage Officer Program 2021–23
Grant for two years of funding to provide support for one officer for each of the 11 Registered Aboriginal Parties to undertake statutory compliance and enforcement functions on behalf of the Minister for Treaty and First Peoples.
Organisation Payment $ Barengi Gadjin Land Council Aboriginal Corporation RNTBC 151,150
Bunurong Land Council Aboriginal Corporation 151,150
Eastern Maar Aboriginal Corporation RNTBC 151,150
First People of the Millewa-Mallee Aboriginal Corporation 151,150
Gunaikurnai Land and Waters Aboriginal Corporation RNTBC 151,150
Gunditj Mirring Traditional Owners Aboriginal Corporation RNTBC 151,150
Taungurung Land and Waters Council (Aboriginal Corporation) 151,150
The Dja Wurrung Clans Aboriginal Corporation 151,150
Wadawurrung Traditional Owners Aboriginal Corporation 151,150
Wurundjeri Woi Wurrung Cultural Heritage Aboriginal Corporation 151,150
Yorta Nation Aboriginal Corporation 151,150
Budj Bim World Heritage Program
Budj Bim 2019–20 to 2022–23
Grant to employ two World Heritage Officers and develop a world heritage strategic management framework to ensure ongoing effective management of Budj Bim by all relevant land managers.
Organisation Payment $ Gunditj Mirring Traditional Owners Aboriginal Corporation RNTBC 160,386
Lake Condah Estate Management Program
Lake Condah Estate Management 2022–24
Grant to support the Gunditj Mirring Traditional Owners Aboriginal Corporation to manage, maintain and operate the former Lake Condah Mission site and surrounding lake area.
Organisation Payment $ GunditJ Mirring Traditional Owners Aboriginal Corporation RNTBC 55,000
Nation-Building Flexible Fund
Weeroona Aboriginal Cemetery (Weeroona) Grants 2021–22
Organisation Payment $ Bubup Wilam For Early Learning Incorporated 181,816
Wurundjeri Woi Wurrung Cultural Heritage Aboriginal Corporation 83,565
RAP Operations Program
RAP Operations Program 2019–22
Grants to work towards the future viability and sustainability of Registered Aboriginal Parties.
Organisation Payment $ Barengi Gadjin Land Council Aboriginal Corporation RNTBC 97,900
First People of the Millewa-Mallee Aboriginal Corporation 108,167
Gunaikurnai Land and Waters Aboriginal Corporation RNTBC 89,833
Wurundjeri Woi Wurrung Cultural Heritage Aboriginal Corporation 50,233
RAP Operations Program 2022–24
Grants to work towards the future viability and sustainability of Registered Aboriginal Parties.
Organisation Payment $ Barengi Gadjin Land Council Aboriginal Corporation RNTBC 701,404
Bunurong Land Council Aboriginal Corporation 683,607
Eastern Maar Aboriginal Corporation RNTBC 662,904
First People of the Millewa-Mallee Aboriginal Corporation 723,405
Gunaikurnai Land and Waters Aboriginal Corporation RNTBC 661,804
Gunditj Mirring Traditional Owners Aboriginal Corporation RNTBC 698,104
Taungurung Land and Waters Council (Aboriginal Corporation) 675,004
Wadawurrung Traditional Owners Aboriginal Corporation 812,307
Wurundjeri Woi Wurrung Cultural Heritage Aboriginal Corporation 699,006
Yorta Nation Aboriginal Corporation 700,305
The Dja Dja Wurrung Clans Aboriginal Corporation 669,504
Strategic Aboriginal heritage assessments
Strategic Aboriginal heritage assessments
Grant to research and map areas of Victoria of Aboriginal cultural significance to Traditional Owners.
Organisation Payment $ Dja Dja Wurrung Clans Aboriginal Corporation 492,059
Gunditj Mirring Traditional Owners Aboriginal Corporation RNTBC 495,000
Wurundjeri Woi-Wurrung Cultural Heritage Aboriginal Corporation 449,900
Strong Roots for Our Futures
Strong Roots for Our Futures Grants 2022–23
Grants to resource foundational activities to support Traditional Owners to build strong groups who are ready to engage in formal recognition processes.
Organisation Payment $ S Ingram 65,000
Yingadi Aboriginal Corporation 40,000
Traditional Owner Nation-Building Support
Core funding
Grant to enable the Federation of Victorian Traditional Owner Corporations to engage with Traditional Owners to facilitate knowledge sharing, capacity building, accountability, advocacy and policy development and advice. The funding also supports the legal and financial administration of the Nation-Building Resource Pool.
Organisation Payment $ Federation of Victorian Traditional Owner Corporations Ltd 825,000
Nation-building resource pool
Grant to support nation-building priorities as determined by Traditional Owners and is equitably available to Traditional Owner groups with formal recognition.
Organisation Payment $ Federation of Victorian Traditional Owner Corporations Ltd 242,000
Nation-building support services
Grant to support Traditional Owner groups across Victoria to engage in nation-building, comprising: Traditional Owner engagement officers in Traditional Owner corporations, Traditional Owner mapping and formal recognition services for Traditional Owners of regions without formal recognition.
Organisation Payment $ Federation of Victorian Traditional Owner Corporations Ltd 110,000
Traditional Owner engagement officers
Grants for Traditional Owner corporations to employ a Traditional Owner engagement officer to help the organisation identify, build and maintain relationships with the organisation’s members and full group.
Organisation Payment $ Barengi Gadjin Land Council Aboriginal Corporation RNTBC 74,967
First People of the Millewa-Mallee Aboriginal Corporation 74,967
Taungurung Land and Waters Council (Aboriginal Corporation) 92,244
Wurundjeri Woi-Wurrung Cultural Heritage Aboriginal Corporation 74,967
The Dja Dja Wurrung Clans Aboriginal Corporation 23,833
Yorta Yorta Nation Aboriginal Corporation 74,967
Traditional Owner mapping
Grant to resource research with, and mapping of, family groups and Traditional Owner structures in the four regions without formal recognition (the Mid North West, Central North, North East and Far East Gippsland).
Organisation Payment $ First Nations Legal & Research Services Ltd 220,000
Executive Government advice and services
Australian Associated Press
Australian Associated Press Ltd Funding Agreement 2021–22
Grant to support the organisation with resourcing and reporting on regional matters as part of a broader package of support for regional media.
Organisation Payment $ Australian Associated Press Ltd 889,000
Updated