The comparative workforce data and Executive Officer data provided in this appendix are based on the following definitions:
- For a department, a member of the Senior Executive Service (SES) is defined as a person employed as an executive under Part 3 of the Public Administration Act 2004.
- For a portfolio entity, an executive is defined as a person employed as an executive under Part 3 of the Public Administration Act or a person to whom the Victorian Government’s Public Entity Executive Remuneration Policy applies.
- The definition of an SES does not include a statutory office holder, an accountable officer or an administrative office head.
All figures in the following tables reflect employment levels at the last full pay period in June 2023 and June 2022.
Comparative data
Executive officer data
The table below discloses the variations in SES, broken down by gender, between the current and previous reporting periods for DPC, excluding SES supporting the Yoorrook Justice Commission.
DPC Senior Executive Service numbers for 2023 and 2022
| Class | Men 2023 | Men 2022 | Men Var | Women 2023 | Women 2022 | Women Var | Self-described 2023 | Self-described 2022 | Self-described Var | Total 2023 | Total 2022 | Total Var |
|---|---|---|---|---|---|---|---|---|---|---|---|---|
| SES 3 | 2 | 4 | –2 | 2 | 4 | –2 | 0 | 0 | 0 | 4 | 8 | –4 |
| SES 2 | 9 | 11 | –2 | 10 | 15 | –5 | 0 | 0 | 0 | 19 | 26 | –7 |
| SES 1 | 10 | 19 | –9 | 23 | 39 | –16 | 0 | 0 | 0 | 33 | 58 | –25 |
| Total | 21 | 34 | –13 | 35 | 58 | –23 | 0 | 0 | 0 | 56 | 92 | –36 |
The table below discloses the variations in SES, broken down by gender, between the current and previous reporting periods for DPC portfolio entities that have been consolidated into the annual report.
DPC portfolio entity Senior Executive Service numbers for 2023 and 2022
| Portfolio entity | Men 2023 | Men 2022 | Men Var | Women 2023 | Women 2022 | Women Var | Self-described 2023 | Self-described 2022 | Self-described Var | Total 2023 | Total 2022 | Total Var |
|---|---|---|---|---|---|---|---|---|---|---|---|---|
| Office of the Chief Parliamentary Counsel | 1 | 1 | 0 | 2 | 1 | 1 | 0 | 0 | 0 | 3 | 2 | 1 |
| Office of the Governor | 1 | 2 | –1 | 1 | 1 | 0 | 0 | 0 | 0 | 2 | 3 | –1 |
| Wage Inspectorate Victoria | 1 | 0 | 1 | 1 | 1 | 0 | 0 | 0 | 0 | 2 | 1 | 1 |
| Total | 3 | 3 | 0 | 4 | 3 | 1 | 0 | 0 | 0 | 7 | 6 | 1 |
The table below provides a reconciliation of executive numbers presented between the report of operations and the financial statements. The table excludes SES employed by the Office of the Chief Parliamentary Counsel, the Office of the Governor, the Wage Inspectorate Victoria and SES supporting the Yoorrook Justice Commission.
Reconciliation of DPC Senior Executive Service numbers
| 2023 | 2022 | ||
|---|---|---|---|
| Executives | 73 | 109 | |
| Accountable Officer (Secretary) | 1 | 1 | |
| Less | Separations | 18 | 17 |
| Total executive numbers | 56 | 93 |
The table below discloses the annualised total salary for senior employees of DPC categorised by classification. The salary amount is reported as the full-time annualised salary. The table excludes SES employed by the Office of the Chief Parliamentary Counsel, the Office of the Governor, the Wage Inspectorate Victoria and SES supporting the Yoorrook Justice Commission.
Annualised total salary, by $20,000 bands, for executives and other senior non-executive staff
| Income band (salary)(2) | Executives | STS | PS | SMA | SRA | Other |
|---|---|---|---|---|---|---|
| < $160,000 | ||||||
| $160,000–$179,999 | 1 | |||||
| $180,000–$199,999 | 4(1) | |||||
| $200,000–$219,999 | 19(1) | 5 | ||||
| $220,000–$239,999 | 12(1) | 1 | ||||
| $240,000–$259,999 | 1 | |||||
| $260,000–$279,999 | 7 | |||||
| $280,000–$299,999 | 9 | |||||
| $300,000–$319,999 | 4 | |||||
| $320,000–$339,999 | ||||||
| $340,000–$359,999 | ||||||
| $360,000–$379,999 | ||||||
| $380,000–$399,999 | 1 | |||||
| $400,000–$419,999 | ||||||
| $420,000–$439,999 | 2 | |||||
| $440,000–$459,999 | ||||||
| $460,000–$479,999 | ||||||
| $480,000–$499,999 | 1 | |||||
| > $500,000 | ||||||
| Total | 56 | 11 |
Legend: FTE: full-time equivalent; STS: senior technical specialists; PS: principal scientists; SMA: senior medical advisers; SRA: senior regulatory analysts
Notes:
- Includes employees on part-time arrangements, which cover the following FTE: 0.60, 0.80 and 0.90 FTE.
- Executives’ remuneration includes superannuation.
Workforce inclusion policy
DPC is committed to creating a workforce that is genuinely inclusive and better reflects the diversity of the communities served.
The table on page 174 outlines the progress DPC has made against key workforce inclusion targets relating to gender profiles at the executive level, people with disability and employees who identify as Aboriginal and/or Torres Strait Islander.
Gender profile at the executive levels
DPC acknowledges gender diversity within its workforce and is committed to developing strategies that promote opportunities for all staff, including gender diverse employees.
Consistent with Safe and Strong: A Victorian Gender Equality Strategy, DPC has a target to ensure at least 50 per cent of women are represented in executive-level officer roles. The representation of women in executive-level roles was 63 per cent in 2022–23.
Under the Gender Equality Act 2020, DPC has a Gender Equality Action Plan that outlines strategies and measures for promoting gender equality in the workplace. The plan considers the needs of all employees including gender diverse staff and examines intersectional gender inequality.
People with disability
Consistent with Getting to Work: Victorian Public Sector Disability Employment Action Plan 2018–2025, DPC has a target of 12 per cent employment of people with disability by 2025. This target is supported by DPC’s Disability Access and Inclusion Plan
2021–2025, an Enablers Network that continues to advocate for issues affecting employees with disability and a dedicated Senior Adviser, Disability Access and Inclusion role, which oversees the improvements to attracting and supporting people with disability through inclusive recruitment, retention and promotion practices.
The Workforce Inclusion Policy table on page 174 shows DPC has fallen back against this target in 2022–23, with no employees disclosing a disability, a decrease from 0.2 per cent in 2021–22. This decrease may be attributed to machinery of government changes on 1 January 2023. People Matter Survey data reports that 9 per cent of DPC staff identify as a person with disability, an increase from 8 per cent in the 2022 survey. The discrepancy between data sources may be due to the survey’s anonymity.
DPC continues to work towards a culture where staff feel comfortable and confident to share diversity information that can inform future workplace inclusion strategies.
Aboriginal and/or Torres Strait Islander staff
DPC is committed to improving the recruitment and retention of Aboriginal and/or Torres Strait Islander staff by creating a culturally safe workplace, strengthening cultural capability and providing flexible and progressive career opportunities.
Barring Djinang is the Victorian public sector’s five-year Aboriginal employment strategy. The strategy adopts an Aboriginal employment target of 2 per cent for the Victorian public sector. DPC met this target in 2022–23, with 3.3 per cent of staff identifying as Aboriginal and/or Torres Strait Islander.
While this represents an increase compared with 2.3 per cent in 2021–22, the overall number of Aboriginal and/or Torres Strait Islander staff at DPC has decreased. However, the data represents an increased proportion of Aboriginal and/or Torres
Strait Islander staff due to the reduction in DPC’s size following machinery of government changes.
Under the Victorian Government Self-Determination Reform Framework, DPC consulted on a new Aboriginal Workforce Strategy in 2022–23, which continues to be reviewed internally. The strategy aims to create a culturally safe workplace and support the recruitment and retention of Aboriginal and/or Torres Strait Islander staff across DPC.
Workforce inclusion policy progress
| Workforce Inclusion Policy initiative | Target | 2022–23 actual % (headcount) | 2021–22 actual % (headcount) |
|---|---|---|---|
| Gender profile at executive levels | Representation of at least 50 per cent women in executive officer roles | 63.0 | 63.0 |
| People with disability | People with disability at DPC increases to 12 per cent by 2025(1) | 0.0 | 0.2 |
| Aboriginal and/or Torres Strait Islander staff | Barring Djinang has adopted an Aboriginal employment target of 2 per cent for the Victorian public service(2) | 3.3 | 2.3 |
Notes:
- Headcount is based on payroll system data. Note, however, that DPC’s 2023 People Matter Survey results indicate that 9 per cent of DPC’s survey respondents identify as a person with disability.
- Headcount is based on payroll system data. Note, however, that DPC’s 2023 People Matter Survey results indicate that 4 per cent of DPC’s survey respondents identify as Aboriginal and/or Torres Strait Islander.
Occupational health and safety management
DPC is committed to operating in a safe and responsible manner that respects the health, safety and wellbeing of staff.
The commitment includes complying with applicable laws, regulations, standards and codes as well as fostering an environment that enables staff to contribute to the continuous improvement of health and safety in their workplace.
A culture committed to high safety standards, incorporating the Victorian public sector Leading the Way framework encourages DPC to take a holistic and inclusive approach to supporting physical health and mental wellbeing at work.
Vision: A workforce that demonstrates both physical and psychosocially safe practices in all aspects of our work.
Mission: To develop a holistic, values-aligned, integrated approach to health, safety and wellbeing.
DPC is moving forward in establishing a supportive and robust safety culture where a drive for safety culture is being shaped and the aim is not about leading safety but leading safely. In supporting safety culture, DPC has committed to redeveloping a health, safety and wellbeing strategy with a strong focus on psychosocial safety.
During 2022–23 DPC worked to review and implement health, safety and wellbeing measures and initiatives that contribute to maintaining the health, safety and wellbeing of all staff. Measures focused on supporting staff wellbeing through the machinery of government changes, and promoting physical health and wellbeing. A review of all health, safety and wellbeing policies and procedures was launched to ensure they align with the newly redeveloped health, safety and wellbeing strategy and identify any gaps that need to be addressed. In addition, updates were made to the
COVID-19 vaccination policy to align with the current health advice and with Victoria’s
COVID-19 landscape.
During 2022–23 DPC continued to support mental wellbeing through initiatives and training in managing mental wellbeing in the workplace.
Incident management
Reported incidents across DPC increased by 2.75 per cent per 100 FTE staff in 2022–23, with 18 incidents reported. This increase equates to 13 more incidents reported compared with the previous year. Incidents include incidents, injuries and near misses.
Similar to the previous year, ‘slips, trips, falls and bumps’ and ‘sprains/strains’ were equally the most commonly reported incident types. The increase in the number of incidents reported this year is attributed to improved employee awareness of reporting incidents, as well as an increase in staff transitioning back into the office environment.
There were no notifiable incidents across DPC in 2022–23. Notifiable incidents are those that require the occupational health and safety (OHS) regulator (WorkSafe) to be notified if they occur.
Number of incidents and rate per 100 FTE
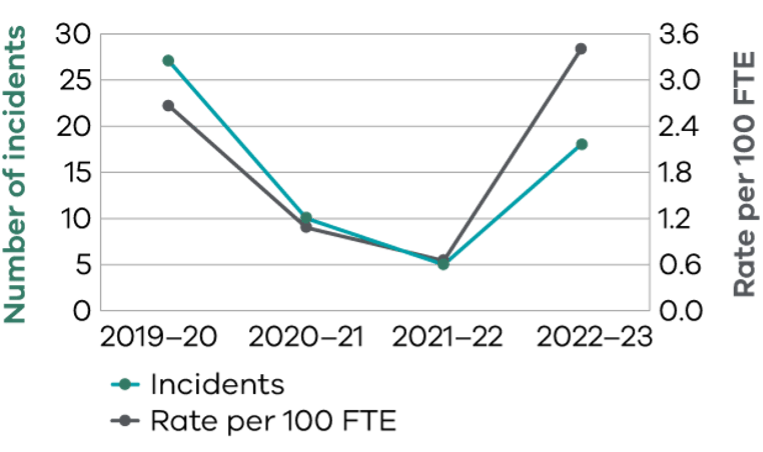
Image description
A line graph which shows the number of incidents and rate of incidents per 100 FTE over the four year period 2019-20 to 2022-23.
The line graph shows the trend for the number of incidents as: between 25 and 30 in 2019-20; between 10 and 15 in 2020-21; between 5 and 10 for 2021-22; and between 15 and 20 for 2022-23.
The line graph shows the trend for the rate of incidents per 100 FTE as: between 2.4 and 3.0 in 2019-20; between 0.6 and 1.2 in 2020-21; between 0.6 and 1.2 in 2021-22; and between 3.0 and 3.6 in 2022-23.
DPC’s performance against occupational health and safety management measures
Incidents
| Key performance indicator | 2020–21 | 2021–22 | 2022–23 |
|---|---|---|---|
| Number of incidents(1) | 10 | 5 | 18 |
| Rate per 100 FTE | 1.08 | 0.65 | 3.40 |
| Number of incidents requiring first aid or further medical treatment | 4 | 2 | 5 |
Incidents
| Key performance indicator | 2020–21 | 2021–22 | 2022–23 |
|---|---|---|---|
| Number of incidents(1) | 10 | 5 | 18 |
| Rate per 100 FTE | 1.08 | 0.65 | 3.40 |
| Number of incidents requiring first aid or further medical treatment | 4 | 2 | 5 |
Management commitment
| Key performance indicator | 2020–21 | 2021–22 | 2022–23 |
|---|---|---|---|
| Evidence of OHS policy statement, OHS objectives, OHS plans and regular reporting to senior management about OHS | Completed | Completed | Completed |
| Evidence of OHS criteria in purchasing guidelines (including goods, services and personnel) | Completed | Completed | Completed |
Consultation and participation
| Key performance indicator | 2020–21 | 2021–22 | 2022–23 |
|---|---|---|---|
| Compliance with agreed structure on designated work groups, health and safety representatives (HSRs) and issue resolution procedures | Completed | Completed | Completed |
| Evidence of agreed structure of designated workgroups, HSRs and issue resolution procedures | Completed | Completed | Completed |
| Number of quarterly OHS Committee meetings | 4 | 4 | 2 |
Risk management
| Key performance indicator | 2020–21 | 2021–22 | 2022–23 |
|---|---|---|---|
| Percentage of internal audits and inspections conducted as planned(2) | n/a | 67% | 32% |
| Percentage of reported incidents investigated | 100% | 100% | 100% |
| Number of improvement notices issued by a WorkSafe inspector | 0 | 0 | 0 |
| Number of prosecutions | 0 | 0 | 0 |
Percentage of issues arising from:
| Key performance indicator | 2020–21 | 2021–22 | 2022–23 |
|---|---|---|---|
| n/a | n/a | n/a |
| n/a | n/a | n/a |
| n/a | n/a | n/a |
Training
Percentage of managers and staff who have received OHS training
(online induction module):
| Key performance indicator | 2020–21 | 2021–22 | 2022–23 |
|---|---|---|---|
| 93% | 93% | 94% |
| 93% | 93% | 96% |
| n/a | n/a | n/a |
Percentage of HSRs trained
| Key performance indicator | 2020–21 | 2021–22 | 2022–23 |
|---|---|---|---|
| 31% | 33% | 33% |
| 8% | 7% | 0% |
Updated